Market & Innovations: Overview
Data
The data-set used here is the result of merging two files: one, obtained from the Nikkei NEEDS Financial Quest, includes corporate financial information, another, extracted from the Institute of Intellectual Property Patent Database (IIP-DB) – captures companies’ technological activity registered with the Japan Patent Office (JPO). The latter source was originally compiled by Goto and Motohashi (2007). Following the example of Hall, Jaffe, and Trajtenberg (2005), I included the companies from pharmaceutical, chemical, machinery and electrical equipment industries as specified in the NEEDS Database.
The total count of companies is 632, with each unit extending over 19 years (from 1998 till 2016), making the obtained time-series considerably larger than any of those used in existing studies on Japan. My sample is also comparable to the majority of the international studies cited here. The resulting data-set analyzed in this article contains 7,813 observations. For the comparison, the data-set employed by Sandner (2010) encompasses 6,757 observations. My data includes fewer companies but stretches across a longer time-frame, which, at the end, brings the number of total cases to the common benchmark.
The problem of classifying patents was addressed by Griliches (1998). On one hand, there is a “target” approach based on the classification of the World Intellectual Property Organization (WIPO) or the National Bureau of Economic Research (NBER). The IIP-DB, on which the current study relies, uses this classification as well (Goto and Motohashi 2007, 1433). It answers the question which field can the respective patent be most fitting at. This, however, entails serious problems for the firm-level study, as the same company can file patents belonging to multiple classes.
“The Patent Office classifies patents into many classes (300+ in the mid-1950s) and even many more subclasses (over 50,000), based on its need to ease the search for prior art. The resulting classification system is based primarily on technological and functional principles and is only rarely related to economists’ notions of products or well-defined industries (which may be a mirage anyway). A subclass dealing with the dispensing of liquids contains both a patent for a water pistol and one for a holy water dispenser.”
Hence, the alternative “origin” approach adopted in this article “starts from patent totals for particular firms and then groups them into industries according to the firm’s primary activity” (Griliches 1998, 294). Following the methodological suggestion by Haneda and Odagiri (1998) (p. 309) that was implemented in all the subsequent works related to Japan, I used the industrial classification present in the NEEDS Database.
The chronological frames are motivated by the following circumstances. On one hand, the lower limit was dictated by the earliest availability of the market-related corporate information. On the other, the latest accessible year in the IIP-DB for the patent applications approved ex post is 2019. However, it takes on average several years for an application to be either rejected or granted. That is why the years 2017 to 2019 so far contain very few information, which will however become more substantial as time passes. As a result, 2016 is the last significant year, for which the patent-related data is available. The length of the patent-registration process is one of the reasons why the curves on the Figure 1 are downward-sloping from the mid-2000s. Application-filing process is especially time-consuming for the Pharmaceutical industry, where the average period for granting a patent is 7.1 years – well above the cumulative mean of 6.45 years.
Although an average time for receiving a patent within the Chemical industry throughout 1971-2014 was roughly the same as within the Electronics, the Figure 1 shows that starting from 1990s Chemical-related applications have required more approval time than the Electric-related ones. Hence, especially for the period analyzed in this article, most challenging conditions for licensing appear to be in Chemical and the related Pharmaceutical industry. This goes hand in hand with the importance of patenting activities for these sectors both in Japan and internationally (Cohen et al. 2002; Hall, Jaffe, and Trajtenberg 2005). In general, it is certainly too early to provide the full information on the number of granted patents filed during the last decade. However, this problem is mitigated by accounting for patents’ stock rather than flow.
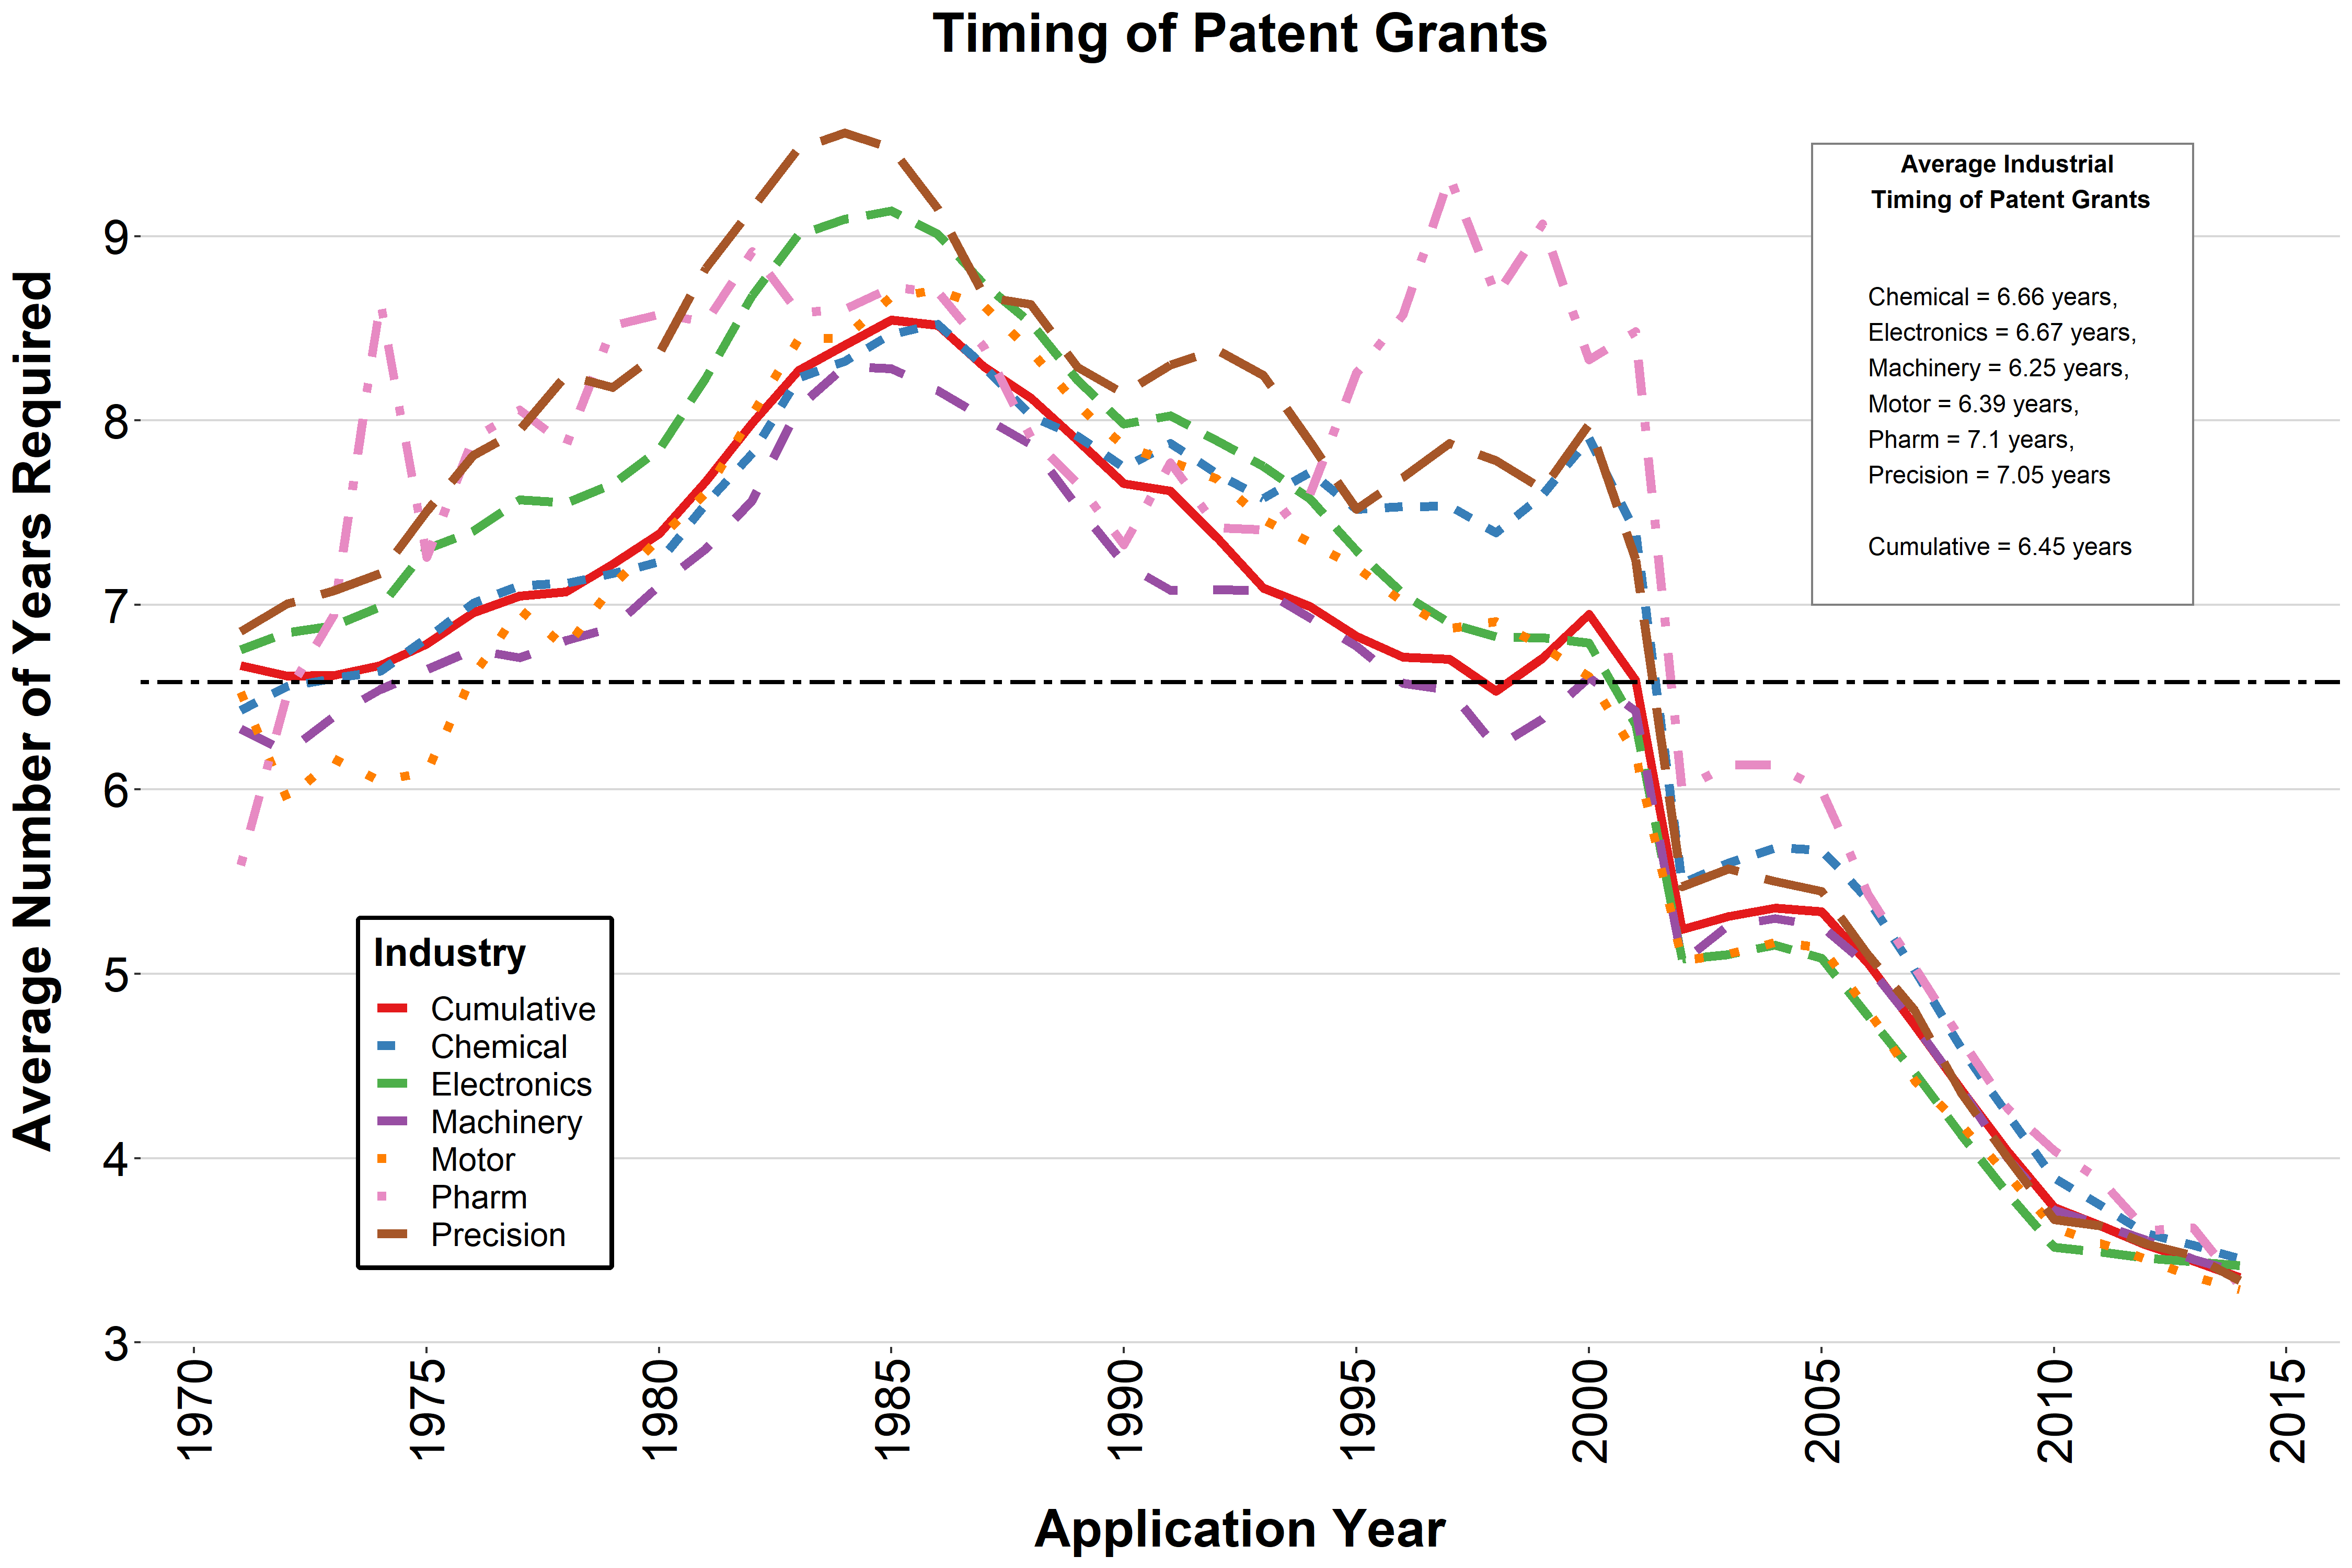
Figure 1: Timing for turning patent applications into grants
While corporate financial data (except the R&D spending) does not entail any particular technical issues, patent-related information needs to meet some criteria before running a regression. Following the methodology adopted in the existing literature, I have used the entries based on the date of filing the patent application, which is a point in time, from which a corresponding invention would be legally protected. However, the copyright mechanism can only be enforced if a patent is subsequently granted. In this case, a corresponding company can receive benefits associated with license possession, apart from the technological improvements an invention may generate (Czarnitzki, Hall, and Oriani 2006, 123). This is the main reason behind choosing only the successful patent applications for this study.
In fact, as seen from the Figure 2, the median granting success rate of patents filed with the Japan Patent Office (JPO) from 1971 to 2014 was 37 percent. This number is very similar to the 35 percent in Germany and is considerably lower compared to countries such as France (90 percent) and the U.K. (80 percent) (Griliches 1998, 289). Although the granting rate has been on a sharp rise in Japan since early 2000s, it is still indicative of a stringent control mechanism that the local application process entails. Schankerman (1998) notes the following: “Patents originating in Japan are substantially more valuable than in other countries, and the difference is most striking for electronics patents” (p. 80). This trend is depicted, among others, on the Figure 2, where Electronics have the lowest granting rate of 30 percent.
At the same time, the comparatively high industrial success rates for Pharmaceuticals (50 percent) and Chemicals (48 percent) do not automatically imply the low quality of the respective patents. It is rather a cause of patents being particularly important for realizing the gains from intangible assets. Differently from Electronics, “in the pharmaceutical industry, patents are perceived as a relatively effective tool of appropriating rents from technological innovations as compared to other types of mechanism such as trade secret, increasing complexity of product design and faster market introduction” (Motohashi 2008, 1548). This has been a common finding across numerous studies concluding that the knowledge assets have the most pronounced role for the market evaluation of companies within the Pharmaceutical sector (Czarnitzki, Hall, and Oriani 2006, 15). Finally, if we look at the yearly cohorts displayed in the Figure 2, the numbers for Pharmaceuticals and Chemicals within the period of 1991-2000 (part of which is included in this article’s econometric analysis) hardly surpass the cumulative median.
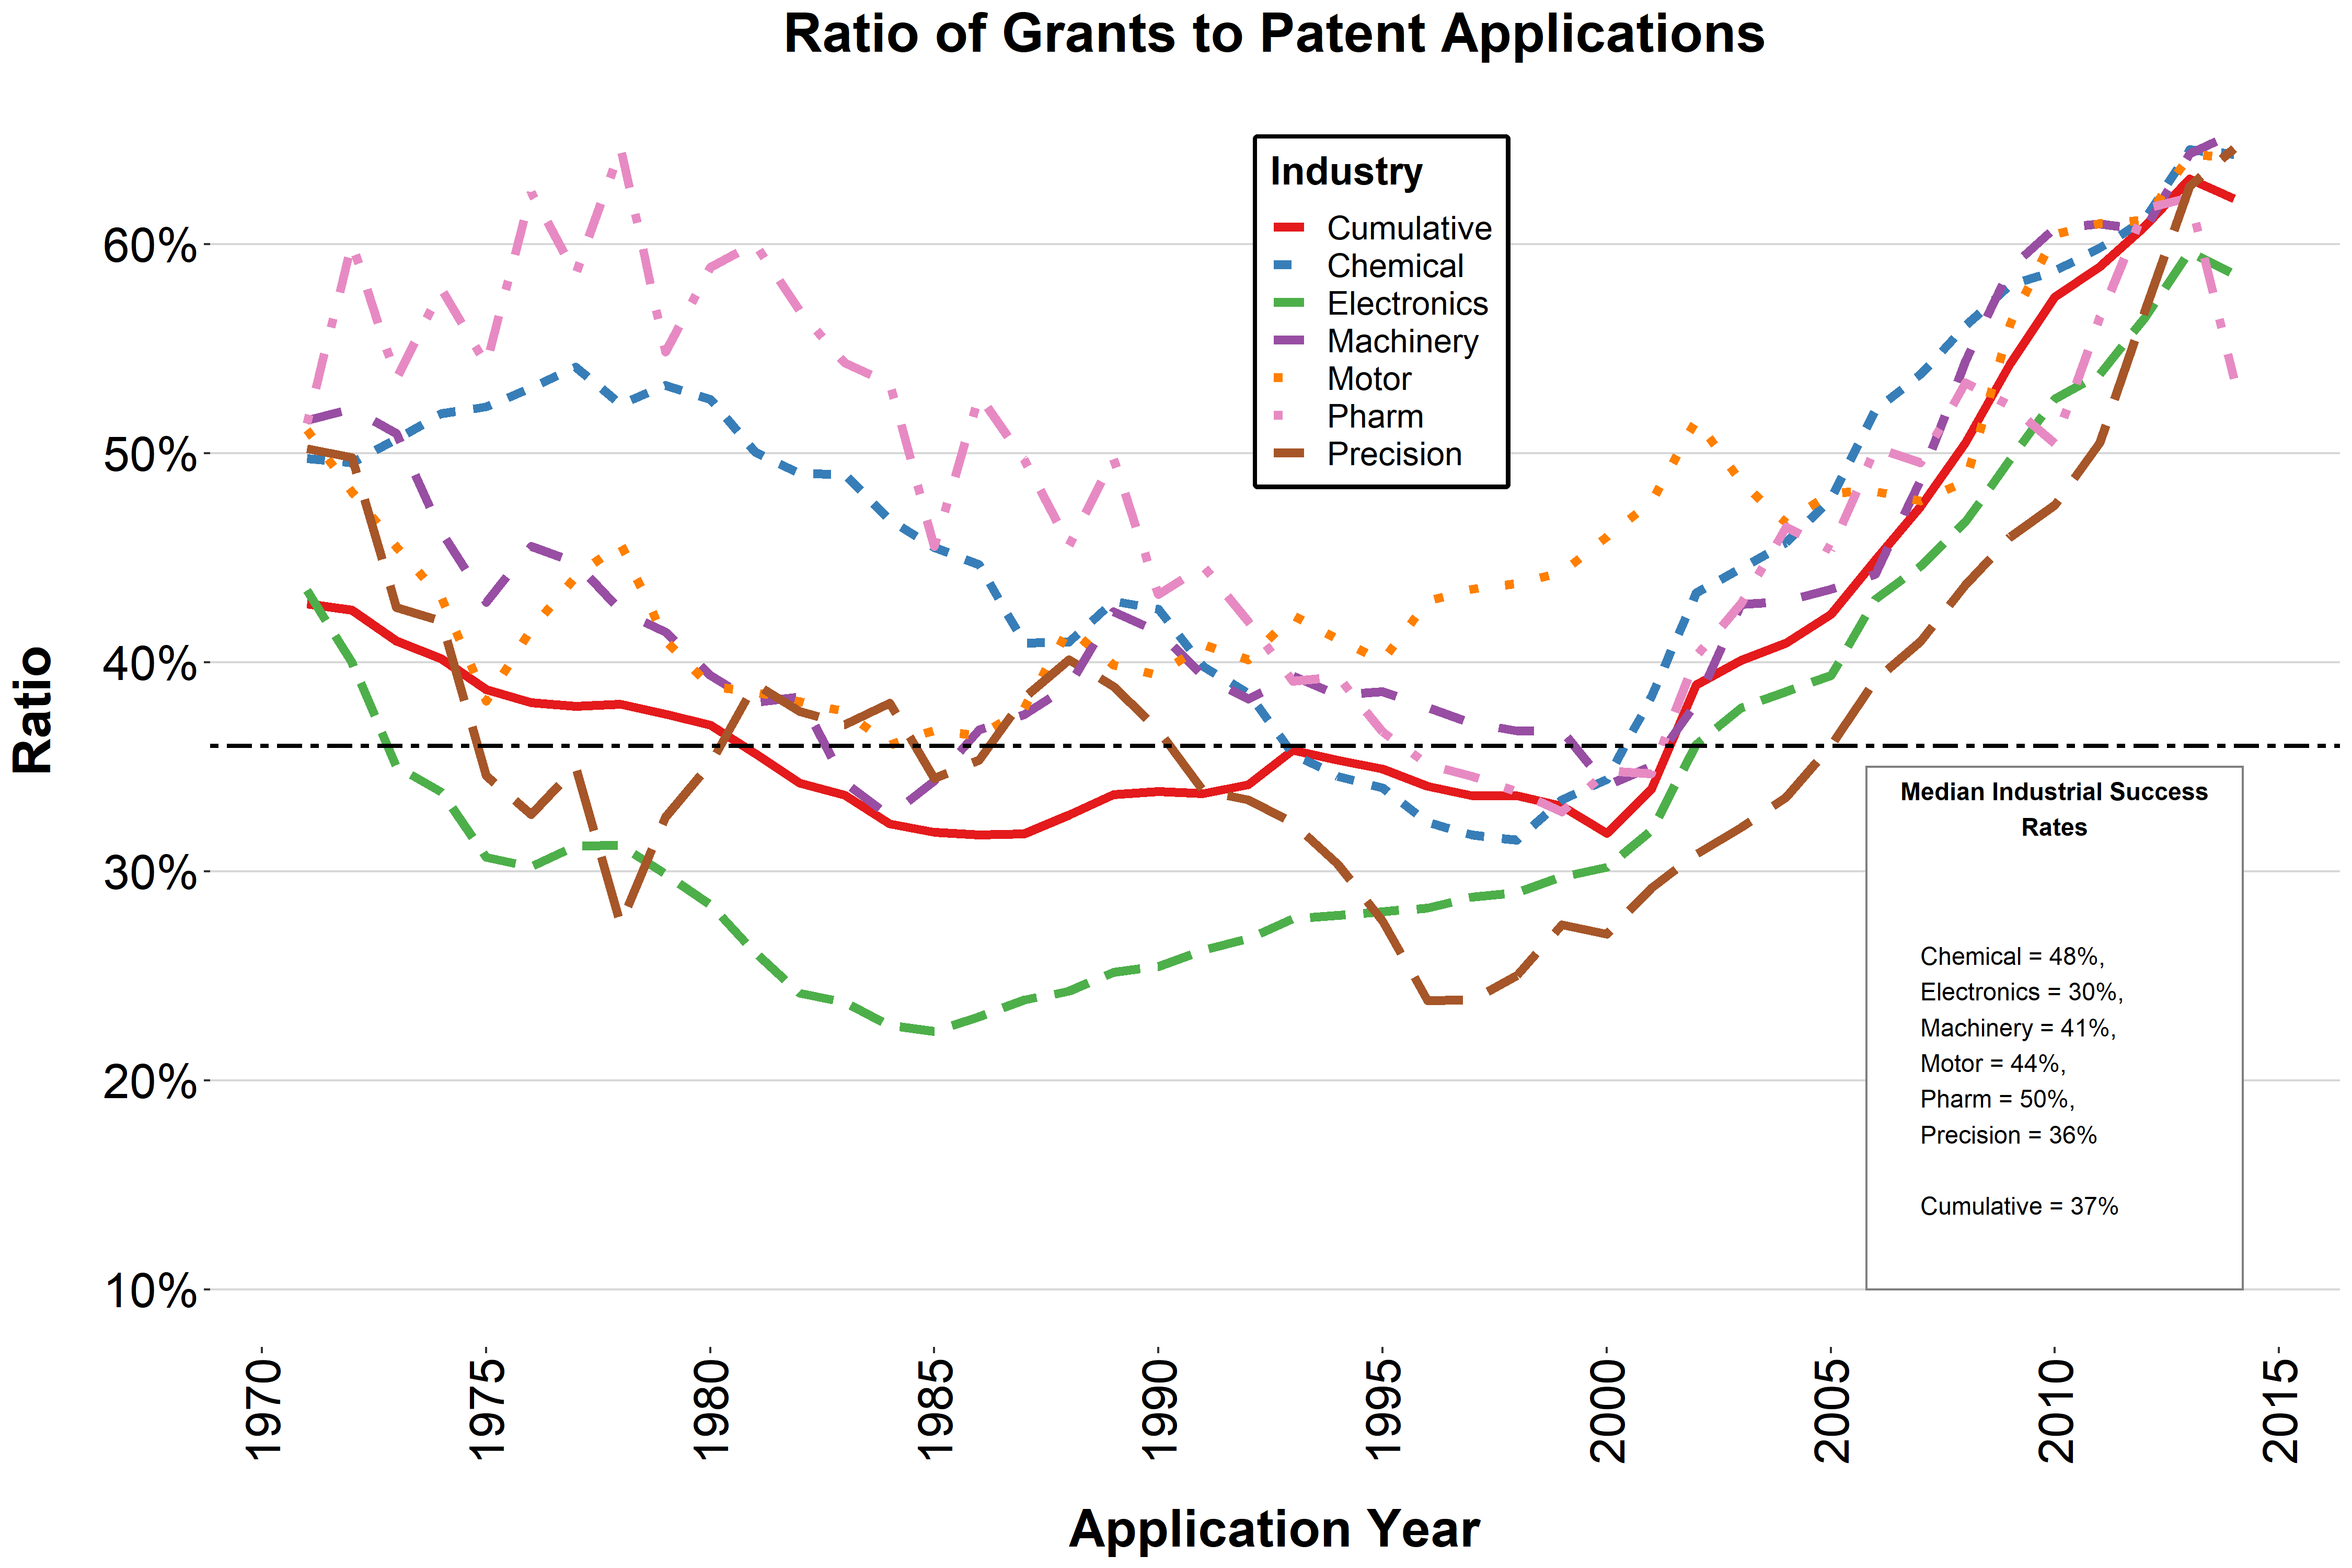
Figure 2: Granting success rate of patents filed with the JPO
Model
Most of the studies on this topic have followed the model developed in the seminal work by Griliches (1981) that was further elaborated in Cockburn and Griliches (1988). According to them, the market value of the firm, V, can be expressed as follows:
\[\begin{equation} V_{it} = \alpha(A_{it} + \beta K_{it}) \tag{1} \end{equation}\]
where A stands for the firm’s tangible assets that include “plant, equipment, inventories, and financial assets” (Griliches 1981, 183), K represents the knowledge stock, and \(\alpha\) – “current market valuation […] of the firm’s assets, reflecting its differential risk and monopoly position” (Griliches 1981, 183).
As the definition of Tobin’s q is the ratio of the market value V of a firm to its book value A, we can rewrite the formula as:
\[\begin{equation} q_t = \frac {V_{it}} {A_{it}} = \alpha \biggl(1 + \beta \frac {K_{it}} {A_{it}}\biggr) \tag{2} \end{equation}\]
Taking the logarithms, we get
\[\begin{equation} \log q_{it} = \log \alpha_t + \log \biggl(1 + \beta \frac {K_{it}} {A_{it}}\biggr) + \varepsilon_{it} \tag{3} \end{equation}\]
where \(\varepsilon_{it}\) is the error term or the noise of the model.
Here, the knowledge stock K consists of three components, such as: R&D weighted by Assets, Patents per dollar of R&D, and Citations per Patent. Incorporating these measurements, we can rewrite the last equation as follows, according to the suggestion of Hall, Jaffe, and Trajtenberg (2005) (p. 24):
\[\begin{equation} \log q_{it} = \log \alpha_t + \log \biggl(1 + \beta_1 \frac {R\&D_{it}} {A_{it}} + \beta_2 \frac {Pat_{it}} {R\&D_{it}} \\ + \beta_3 \frac {Cites_{it}} {Pat_{it}}\biggr) + \varepsilon_{it} \tag{4} \end{equation}\]
References
Kostiantyn Ovsiannikov
Assistant Professor
My research interests include labor economics, experimental economics and political economy.