Market Valuation of Corporate Technological Assets:
The Case of Japan’s Institutional Adaptability
2021 SASE Conference:
Network F-KITE “Institutional Logics and Change”
Kostiantyn Ovsiannikov, Ph.D.
Kochi University of Technology
2 July 2021
Background: Japan's intrapreneurial regime
Background: Japan's intrapreneurial regime
large companies financial institutions
Background: Japan's intrapreneurial regime
large companies financial institutions
low employment turnover rates employees' loyalty
Background: Japan's intrapreneurial regime
large companies financial institutions
low employment turnover rates employees' loyalty
accumulated firm-specific knowledge
Background: Japan's intrapreneurial regime
large companies financial institutions
low employment turnover rates employees' loyalty
accumulated firm-specific knowledge
routinized innovation model well-established R&D departments
Why current research matters
- Japan has the 3rd-largest market capitalization for listed companies in the
Why current research matters
Japan has the 3rd-largest market capitalization for listed companies in the
both patenting quality and quantity are among the highest in the
Why current research matters
Japan has the 3rd-largest market capitalization for listed companies in the
both patenting quality and quantity are among the highest in the
distinct corporate institutional arrangements (relational finance & stakeholder governance)
Why current research matters
Japan has the 3rd-largest market capitalization for listed companies in the
both patenting quality and quantity are among the highest in the
distinct corporate institutional arrangements (relational finance & stakeholder governance)
Why current research matters
Japan has the 3rd-largest market capitalization for listed companies in the
both patenting quality and quantity are among the highest in the
distinct corporate institutional arrangements (relational finance & stakeholder governance)
- However, during the last 30 years, Japan has witnessed institutional , as market influence has
legislation promoting market competition has been toughened -- 2005 amendment of Japan's Anti-Monopoly Act
entry barriers lowered for pharmaceuticals during the late-1990s, which paved a path to a more intensive industrial competition
similar processes have been observed in Japan's electric sector since mid-1990s, leading to a higher R&D efficiency as well as more intensive patenting
these developments invited further attention to changing market perceptions of corporate innovations amid the ongoing balance shift from the institutional towards a more market-based industrial model
RQ & Hypotheses
How does Tokyo Stock Exchange (TSE) evaluate corporate innovations?
RQ & Hypotheses
How does Tokyo Stock Exchange (TSE) evaluate corporate innovations?
Hypothesis 1
TSE positively evaluates companies with higher R&D expenditures. This represents the institutional aspect of corporate innovations.
- R&D stock is a long-term institutional signaling; attribute of a network-based business approach that works in the regulated and coordinated environment
RQ & Hypotheses
How does Tokyo Stock Exchange (TSE) evaluate corporate innovations?
Hypothesis 1
TSE positively evaluates companies with higher R&D expenditures. This represents the institutional aspect of corporate innovations.
Hypothesis 2
TSE positively evaluates companies whose R&D expenditures yield higher patent stocks. This represents the quantitative-market aspect of corporate innovative policies.
- R&D stock is a long-term institutional signaling; attribute of a network-based business approach that works in the regulated and coordinated environment
- Patents' quantity and quality are preconditions for successfully waging market competition. Here, not only the mere R&D spending, but rather R&D efficiency matters
RQ & Hypotheses
How does Tokyo Stock Exchange (TSE) evaluate corporate innovations?
Hypothesis 1
TSE positively evaluates companies with higher R&D expenditures. This represents the institutional aspect of corporate innovations.
Hypothesis 2
TSE positively evaluates companies whose R&D expenditures yield higher patent stocks. This represents the quantitative-market aspect of corporate innovative policies.
Hypothesis 3
TSE positively evaluates influential patents judged by the number of citations accruing to them. This represents the qualitative-market aspect of innovative policies.
- R&D stock is a long-term institutional signaling; attribute of a network-based business approach that works in the regulated and coordinated environment
- Patents' quantity and quality are preconditions for successfully waging market competition. Here, not only the mere R&D spending, but rather R&D efficiency matters
Data
- 684 companies 19 years (1998 — 2016)
- 12,996 observations outliers 8,038 observations.
- Nikkei NEEDS Financial Quest
- Institute of Intellectual Property Patent Database (IIP-DB) (Goto and Motohashi, 2007)
Pharmaceutical
Chemical
Machinery
Electrical Equipment
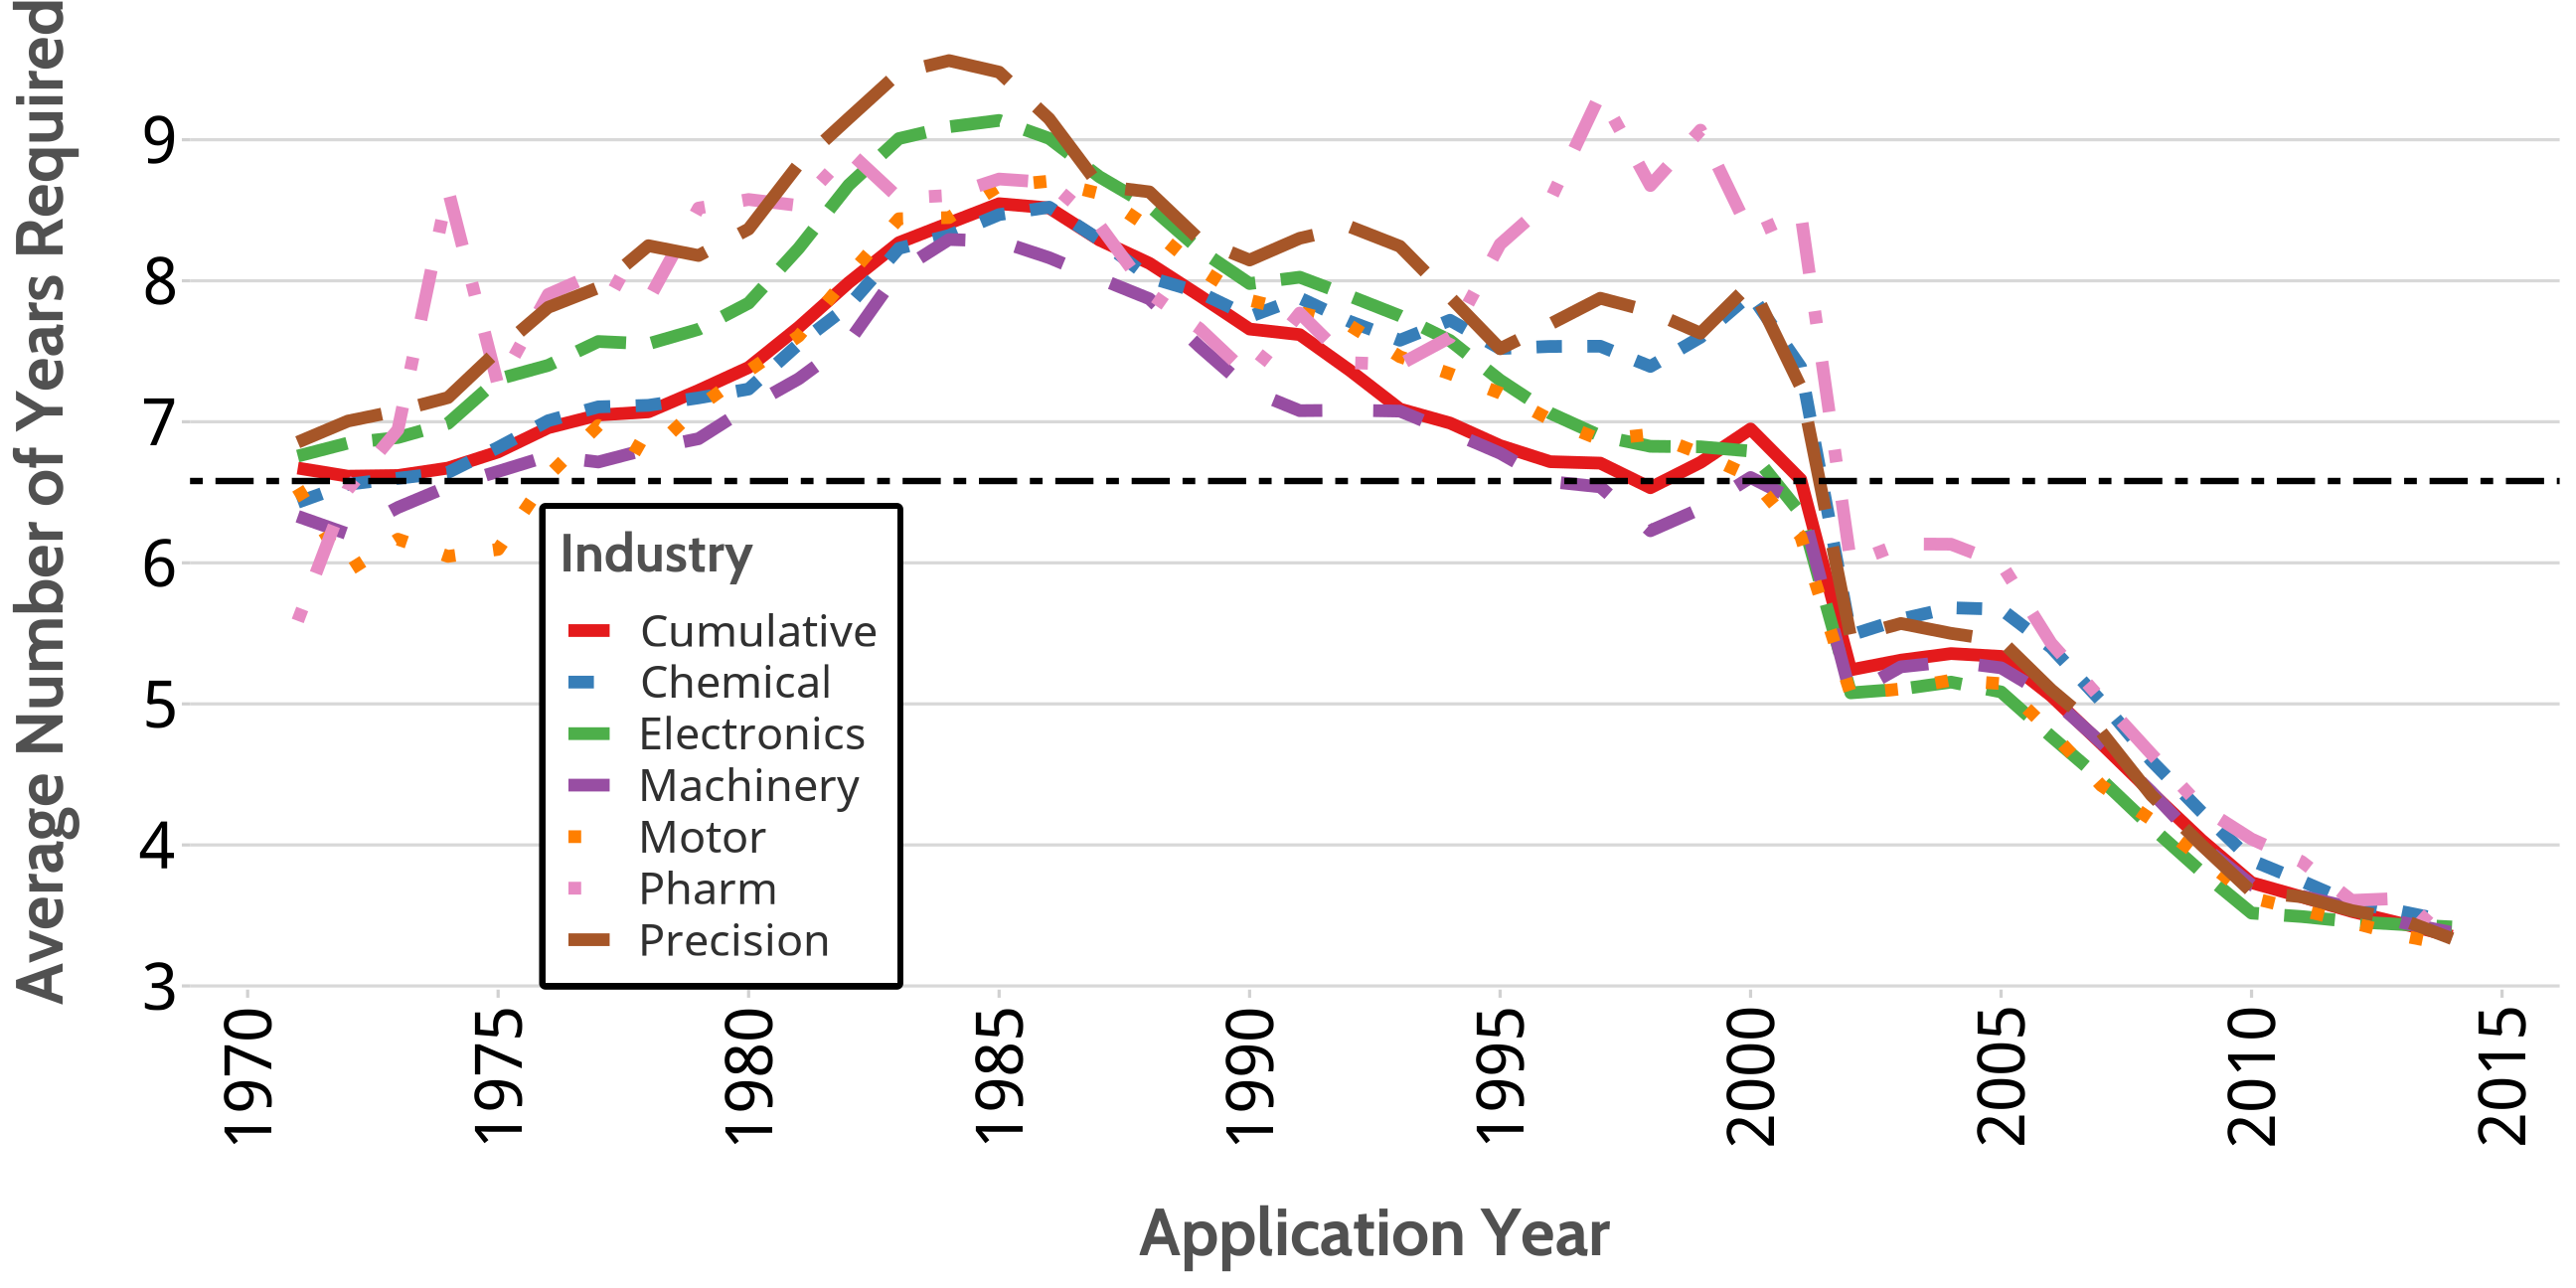
Plot
In 1994, the pre-grant opposition system was replaced for the post-grant one, thereby eliminating potential procedural delays.
In 1998, the punishments for the copy-rights infringements were severed. Due to this, patentees had more solid reasons to seek for the legal protection of their inventions.
In 1999, the period for the compulsory request for patent examination was decreased from 7 to 3 years from the date of application. Thereby, many applicants were prompted to speed up the registration of their inventions.
Table
Application-filing process is especially time-consuming for the Pharmaceutical industry, where the average period for granting a patent is 7.1 years -- well above the cumulative mean of 6.45 years.
Although an average time for receiving a patent within the Chemical industry throughout 1971-2014 was roughly the same as within the Electronics, starting from 1990s Chemical-related applications have required more approval time than the Electric-related ones.
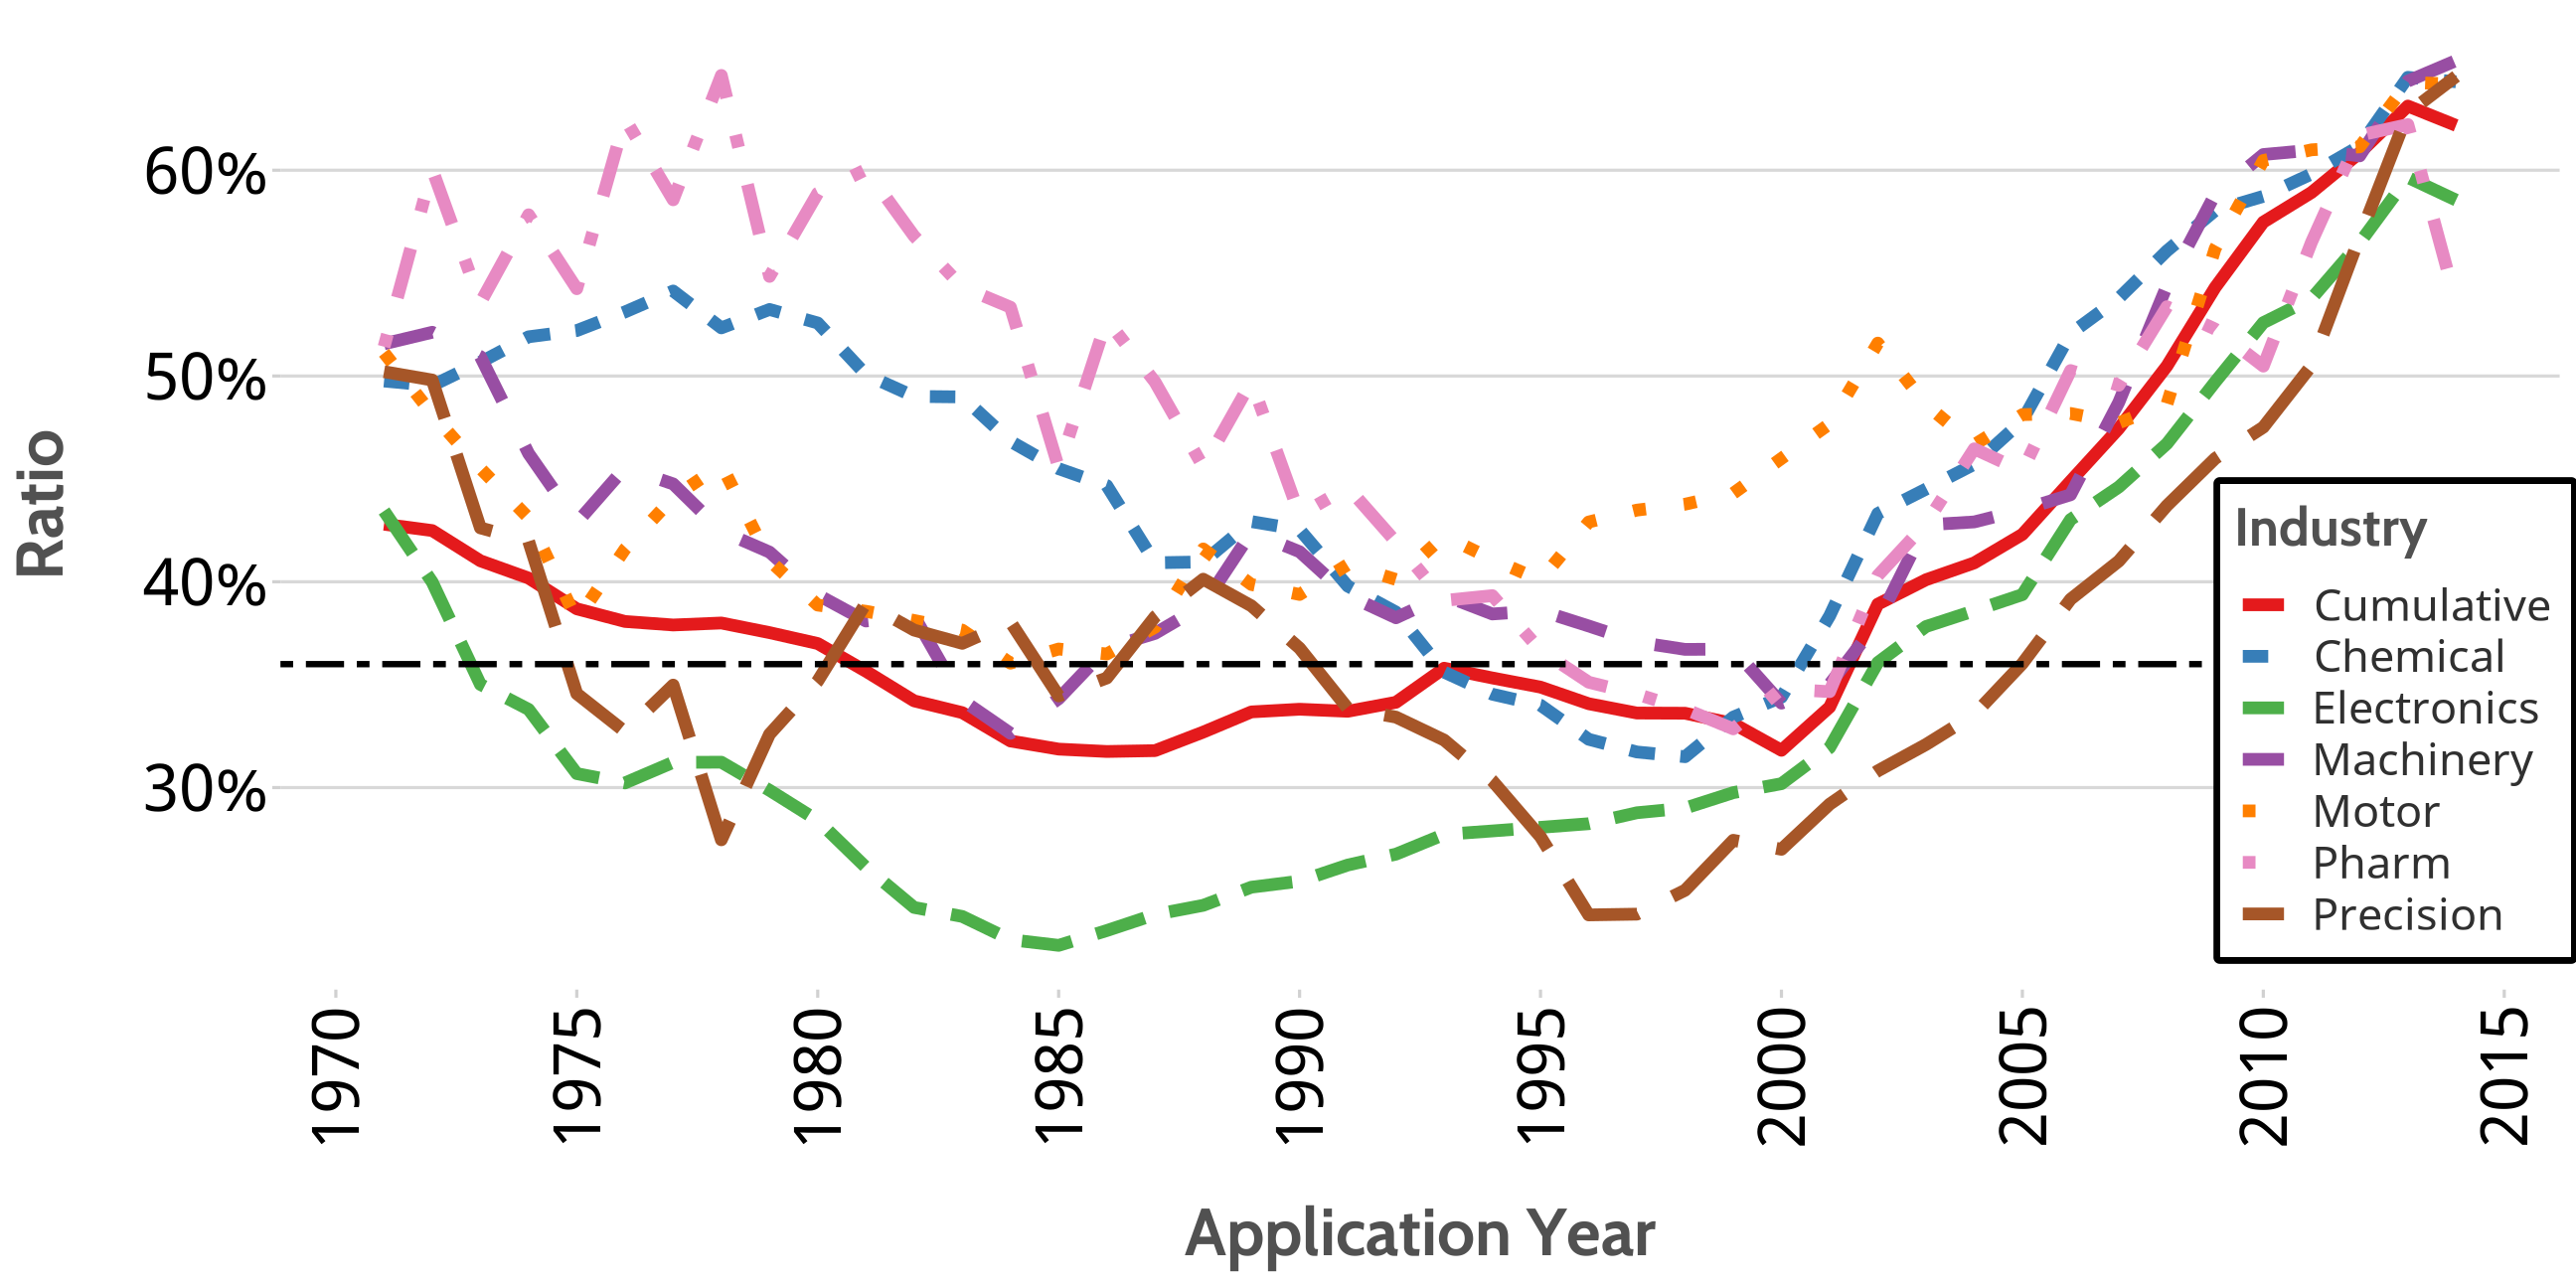
Plot
Median granting success rate of patents filed with the Japan Patent Office (JPO) from 1971 to 2014 was 37 percent. Very similar to the 35 percent in Germany and is considerably lower compared to countries such as France (90 percent) and the U.K. (80 percent) [griliches1998, p. 289].
Although the granting rate has been on a sharp rise in Japan since early 2000s, it is still indicative of a stringent control mechanism that the local application process entails.
Table
comparatively high industrial success rates for Pharmaceuticals (50 percent) and Chemicals (48 percent) are a cause of patents being particularly important for realizing the gains from intangible assets.
"In the pharmaceutical industry, patents are perceived as a relatively effective tool of appropriating rents from technological innovations as compared to other types of mechanism such as trade secret, increasing complexity of product design and faster market introduction" [Motohashi.2008, p. 1548].
Methodology
Methodology
- Market value of the firm, V, can be expressed as follows (Griliches, 1981):
Vit=α(Ait+βKit)Vit=α(Ait+βKit)
where A — firm's tangible assets, K — knowledge stock, and αα — market valuation of the firm’s assets
Methodology
- Market value of the firm, V, can be expressed as follows (Griliches, 1981):
Vit=α(Ait+βKit)Vit=α(Ait+βKit)
where A — firm's tangible assets, K — knowledge stock, and αα — market valuation of the firm’s assets
- Tobin's q = market value V / book value A
qt=VitAit=α(1+βKitAit)+εitqt=VitAit=α(1+βKitAit)+εit
- Knowledge stock K: R&D / Tangible Assets, Patents per Japanese yen spent on R&D, Citations per Patent (Hall, Jaffe, and Trajtenberg, 2005)
logqit=logαt+log(1+β1R&DitAit+β2PatitR&Dit+β3CitesitPatit)+εitlogqit=logαt+log(1+β1R&DitAit+β2PatitR&Dit+β3CitesitPatit)+εit
To sum up, Tobins's Q can be expressed as the sum of knowledge stocks weighted by tangible assets.
OLS regression
| OLS | OLS (Industrial) | |
|---|---|---|
| Constant | −0.316 (0.055)*** | −0.407 (0.068)*** |
| D (Electric) | 0.069 (0.015)*** | 0.068 (0.076) |
| D (Machinery) | 0.012 (0.029) | 0.255 (0.069)*** |
| D (Pharm) | 0.356 (0.025)*** | 0.268 (0.132)* |
| R&D/Assets (x Chemical) | 0.019 (0.066) | 0.608 (0.096)*** |
| R&D/Assets x Electric | −0.288 (0.093)** | |
| R&D/Assets x Machinery | 0.611 (0.178)*** | |
| R&D/Assets x Pharm | 0.537 (0.204)** | |
| Patents/R&D (x Chemical) | 0.024 (0.081) | 1.018 (0.156)*** |
| Patents/R&D x Electric | −0.916 (0.207)*** | |
| Patents/R&D x Machinery | −2.640 (0.251)*** | |
| Patents/R&D x Pharm | −0.729 (0.520) | |
| Citations/Patents (x Chemical) | 0.058 (0.013)*** | −0.014 (0.018) |
| Citations/Patents x Electric | 0.187 (0.026)*** | |
| Citations/Patents x Machinery | 0.103 (0.026)*** | |
| Citations/Patents x Pharm | −0.033 (0.037) | |
| R&D Intensity | 0.738 (0.118)*** | 0.044 (0.130) |
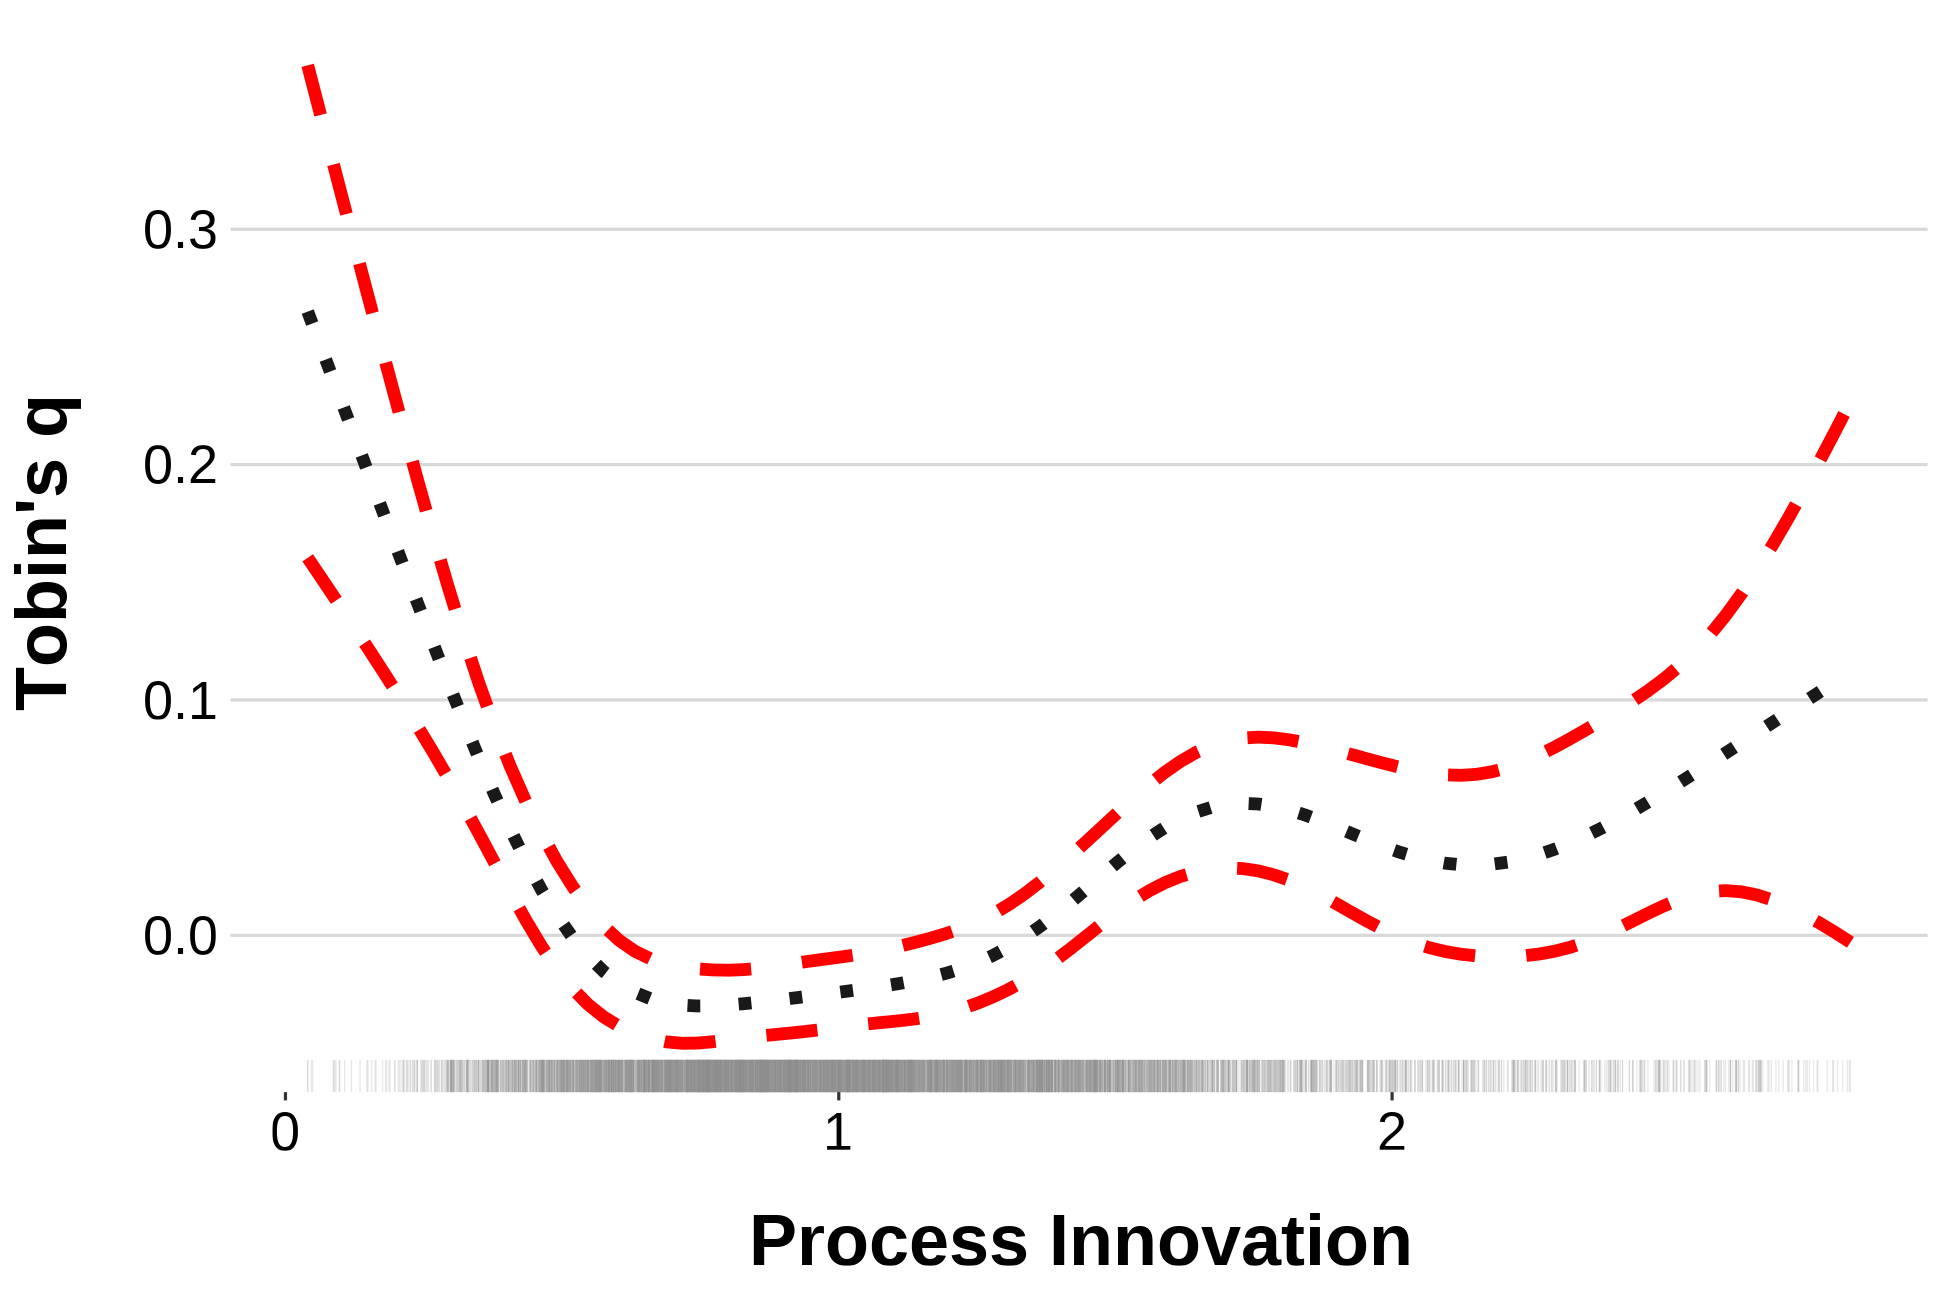
| Process Innovation | 0.033 (0.011)** | 0.032 (0.011)** |
| Leverage | 1.287 (0.038)*** | 1.086 (0.042)*** |
| ROA | 2.716 (0.106)*** | 2.656 (0.106)*** |
| Capital Intensity | 0.038 (0.005)*** | 0.045 (0.005)*** |
| Age | −0.001 (0.000)*** | −0.001 (0.000)*** |
| Num.Obs. | 6903 | 6903 |
| R2 | 0.292 | 0.310 |
| RMSE | 0.41 | 0.40 |
OLS regression
| OLS | OLS (Industrial) | |
|---|---|---|
| Constant | −0.316 (0.055)*** | −0.407 (0.068)*** |
| D (Electric) | 0.069 (0.015)*** | 0.068 (0.076) |
| D (Machinery) | 0.012 (0.029) | 0.255 (0.069)*** |
| D (Pharm) | 0.356 (0.025)*** | 0.268 (0.132)* |
| R&D/Assets (x Chemical) | 0.019 (0.066) | 0.608 (0.096)*** |
| R&D/Assets x Electric | −0.288 (0.093)** | |
| R&D/Assets x Machinery | 0.611 (0.178)*** | |
| R&D/Assets x Pharm | 0.537 (0.204)** | |
| Patents/R&D (x Chemical) | 0.024 (0.081) | 1.018 (0.156)*** |
| Patents/R&D x Electric | −0.916 (0.207)*** | |
| Patents/R&D x Machinery | −2.640 (0.251)*** | |
| Patents/R&D x Pharm | −0.729 (0.520) | |
| Citations/Patents (x Chemical) | 0.058 (0.013)*** | −0.014 (0.018) |
| Citations/Patents x Electric | 0.187 (0.026)*** | |
| Citations/Patents x Machinery | 0.103 (0.026)*** | |
| Citations/Patents x Pharm | −0.033 (0.037) | |
| R&D Intensity | 0.738 (0.118)*** | 0.044 (0.130) |
| Process Innovation | 0.033 (0.011)** | 0.032 (0.011)** |
| Leverage | 1.287 (0.038)*** | 1.086 (0.042)*** |
| ROA | 2.716 (0.106)*** | 2.656 (0.106)*** |
| Capital Intensity | 0.038 (0.005)*** | 0.045 (0.005)*** |
| Age | −0.001 (0.000)*** | −0.001 (0.000)*** |
| Num.Obs. | 6903 | 6903 |
| R2 | 0.292 | 0.310 |
| RMSE | 0.41 | 0.40 |
Industrial premium
- Belonging to Pharmaceuticals per se implies a premium in terms of market valuation of corporate knowledge assets.
OLS regression
| OLS | OLS (Industrial) | |
|---|---|---|
| Constant | −0.316 (0.055)*** | −0.407 (0.068)*** |
| D (Electric) | 0.069 (0.015)*** | 0.068 (0.076) |
| D (Machinery) | 0.012 (0.029) | 0.255 (0.069)*** |
| D (Pharm) | 0.356 (0.025)*** | 0.268 (0.132)* |
| R&D/Assets (x Chemical) | 0.019 (0.066) | 0.608 (0.096)*** |
| R&D/Assets x Electric | −0.288 (0.093)** | |
| R&D/Assets x Machinery | 0.611 (0.178)*** | |
| R&D/Assets x Pharm | 0.537 (0.204)** | |
| Patents/R&D (x Chemical) | 0.024 (0.081) | 1.018 (0.156)*** |
| Patents/R&D x Electric | −0.916 (0.207)*** | |
| Patents/R&D x Machinery | −2.640 (0.251)*** | |
| Patents/R&D x Pharm | −0.729 (0.520) | |
| Citations/Patents (x Chemical) | 0.058 (0.013)*** | −0.014 (0.018) |
| Citations/Patents x Electric | 0.187 (0.026)*** | |
| Citations/Patents x Machinery | 0.103 (0.026)*** | |
| Citations/Patents x Pharm | −0.033 (0.037) | |
| R&D Intensity | 0.738 (0.118)*** | 0.044 (0.130) |
| Process Innovation | 0.033 (0.011)** | 0.032 (0.011)** |
| Leverage | 1.287 (0.038)*** | 1.086 (0.042)*** |
| ROA | 2.716 (0.106)*** | 2.656 (0.106)*** |
| Capital Intensity | 0.038 (0.005)*** | 0.045 (0.005)*** |
| Age | −0.001 (0.000)*** | −0.001 (0.000)*** |
| Num.Obs. | 6903 | 6903 |
| R2 | 0.292 | 0.310 |
| RMSE | 0.41 | 0.40 |
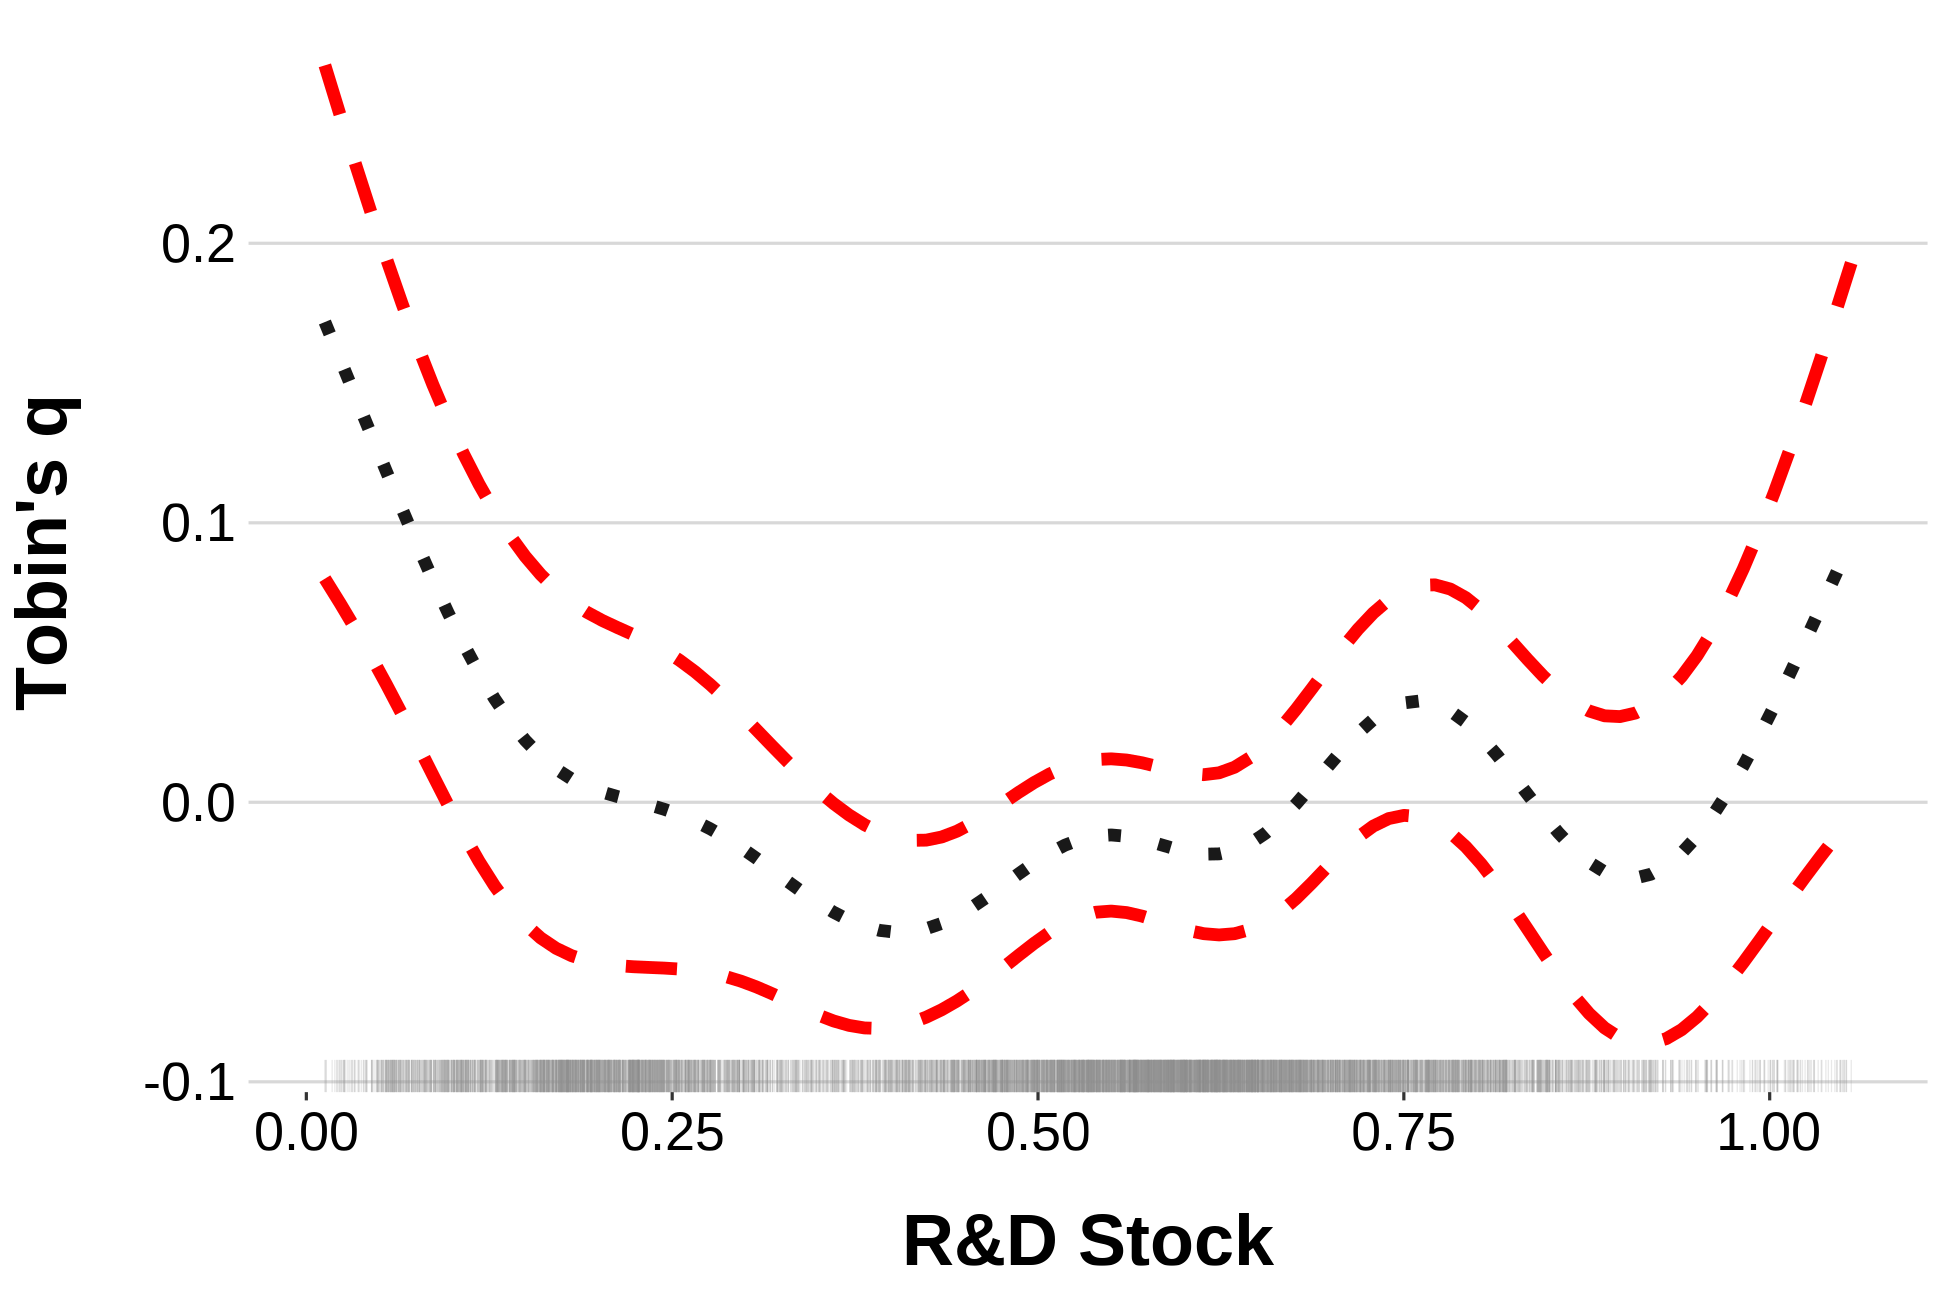
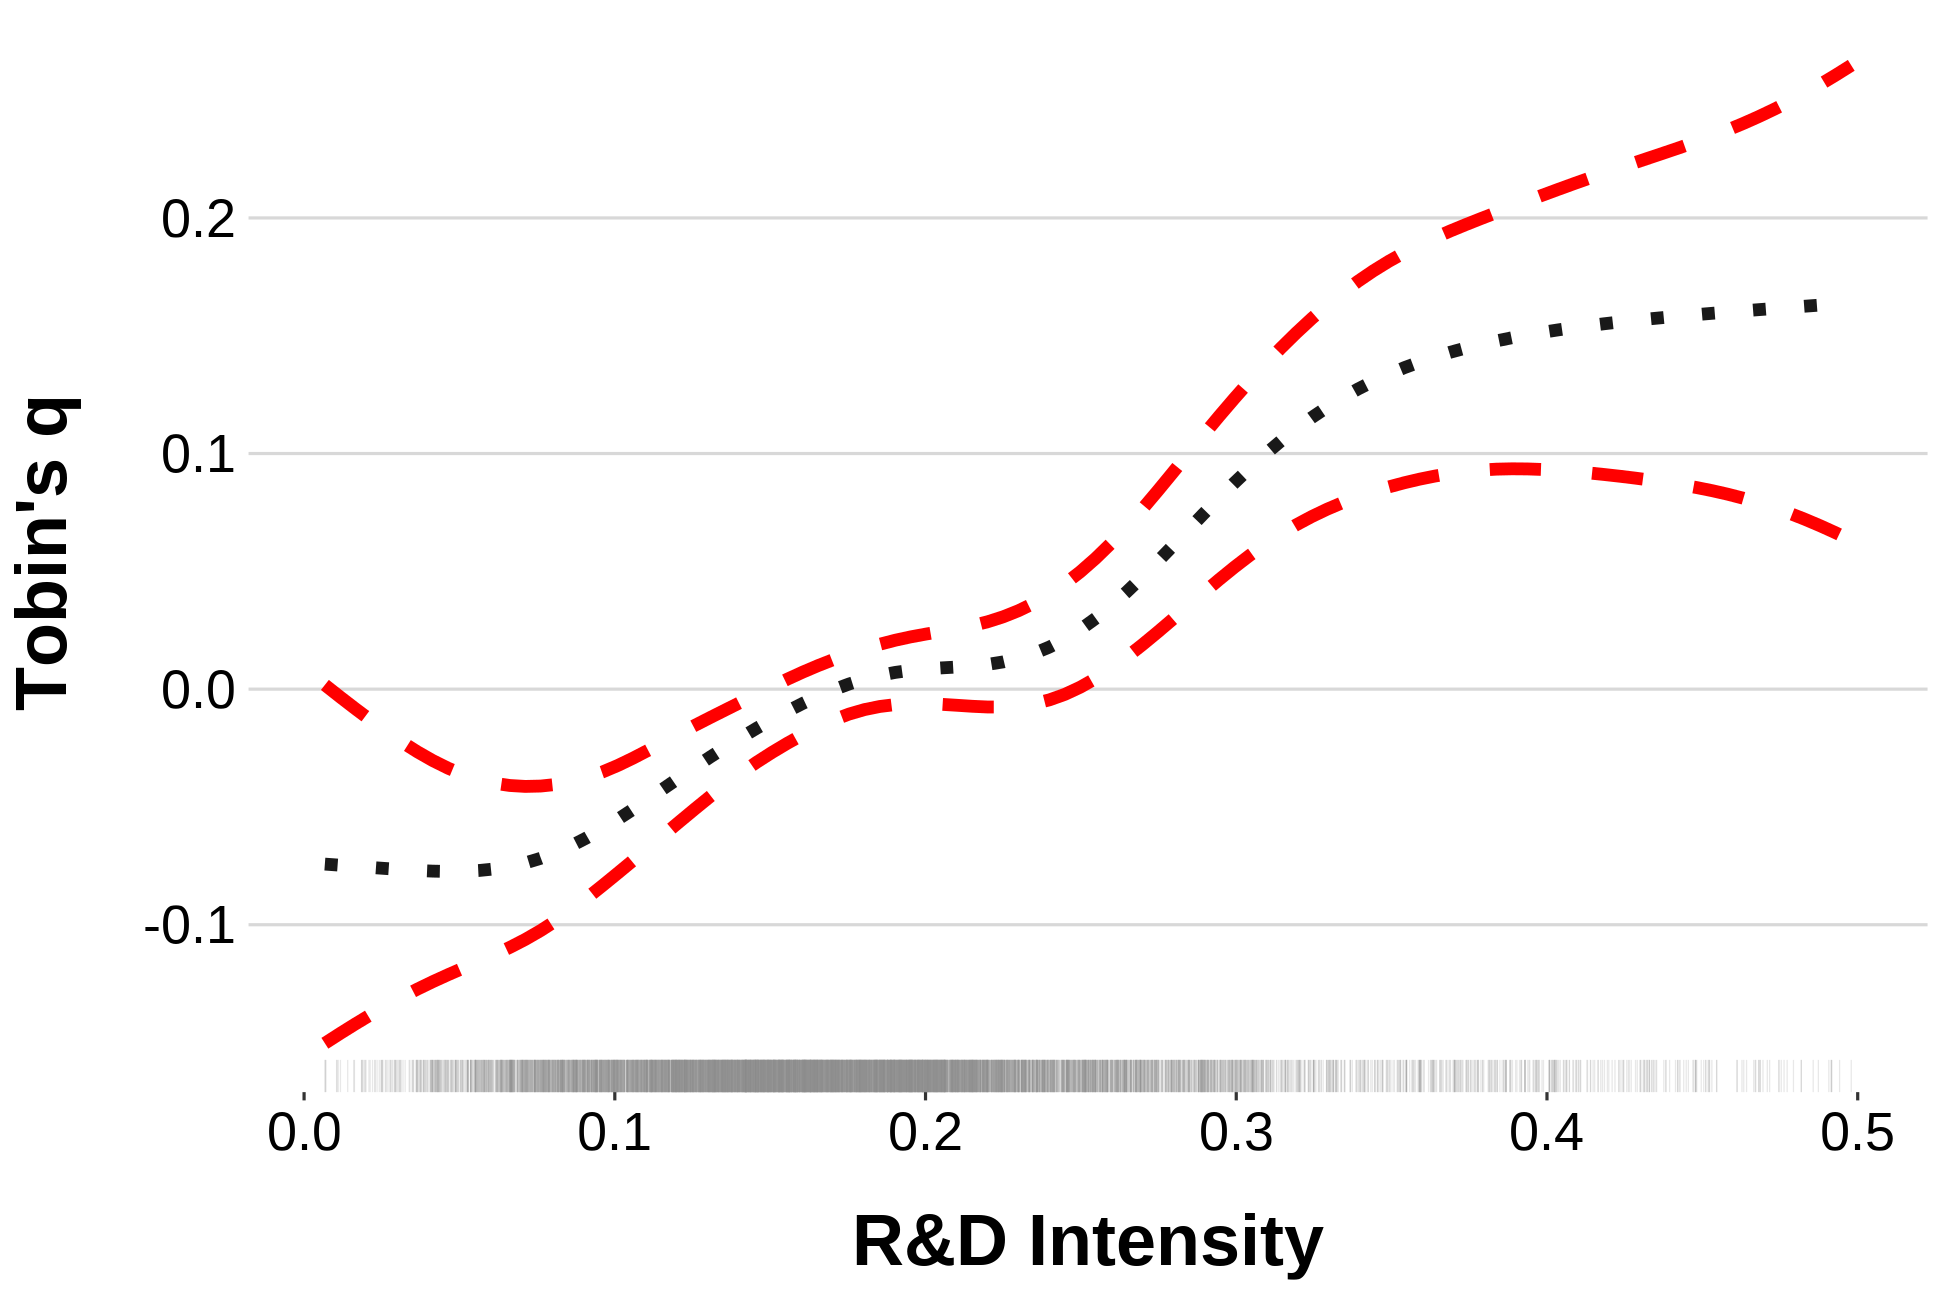
R&D stock
Drugs are notable for the marketability of their R&D expenditures (R&D stock weighted by Assets).
The same holds true about the positive assessment of R&D stocks for Chemicals and Machinery.
(Linear model does not capture this but) market does appreciate R&D spending by the Electric Equipment companies when the R&D stock levels exceed the lower quartile of the observed range.
Thus, R&D spending is actually universally important for all industries
OLS regression
| OLS | OLS (Industrial) | |
|---|---|---|
| Constant | −0.316 (0.055)*** | −0.407 (0.068)*** |
| D (Electric) | 0.069 (0.015)*** | 0.068 (0.076) |
| D (Machinery) | 0.012 (0.029) | 0.255 (0.069)*** |
| D (Pharm) | 0.356 (0.025)*** | 0.268 (0.132)* |
| R&D/Assets (x Chemical) | 0.019 (0.066) | 0.608 (0.096)*** |
| R&D/Assets x Electric | −0.288 (0.093)** | |
| R&D/Assets x Machinery | 0.611 (0.178)*** | |
| R&D/Assets x Pharm | 0.537 (0.204)** | |
| Patents/R&D (x Chemical) | 0.024 (0.081) | 1.018 (0.156)*** |
| Patents/R&D x Electric | −0.916 (0.207)*** | |
| Patents/R&D x Machinery | −2.640 (0.251)*** | |
| Patents/R&D x Pharm | −0.729 (0.520) | |
| Citations/Patents (x Chemical) | 0.058 (0.013)*** | −0.014 (0.018) |
| Citations/Patents x Electric | 0.187 (0.026)*** | |
| Citations/Patents x Machinery | 0.103 (0.026)*** | |
| Citations/Patents x Pharm | −0.033 (0.037) | |
| R&D Intensity | 0.738 (0.118)*** | 0.044 (0.130) |
| Process Innovation | 0.033 (0.011)** | 0.032 (0.011)** |
| Leverage | 1.287 (0.038)*** | 1.086 (0.042)*** |
| ROA | 2.716 (0.106)*** | 2.656 (0.106)*** |
| Capital Intensity | 0.038 (0.005)*** | 0.045 (0.005)*** |
| Age | −0.001 (0.000)*** | −0.001 (0.000)*** |
| Num.Obs. | 6903 | 6903 |
| R2 | 0.292 | 0.310 |
| RMSE | 0.41 | 0.40 |
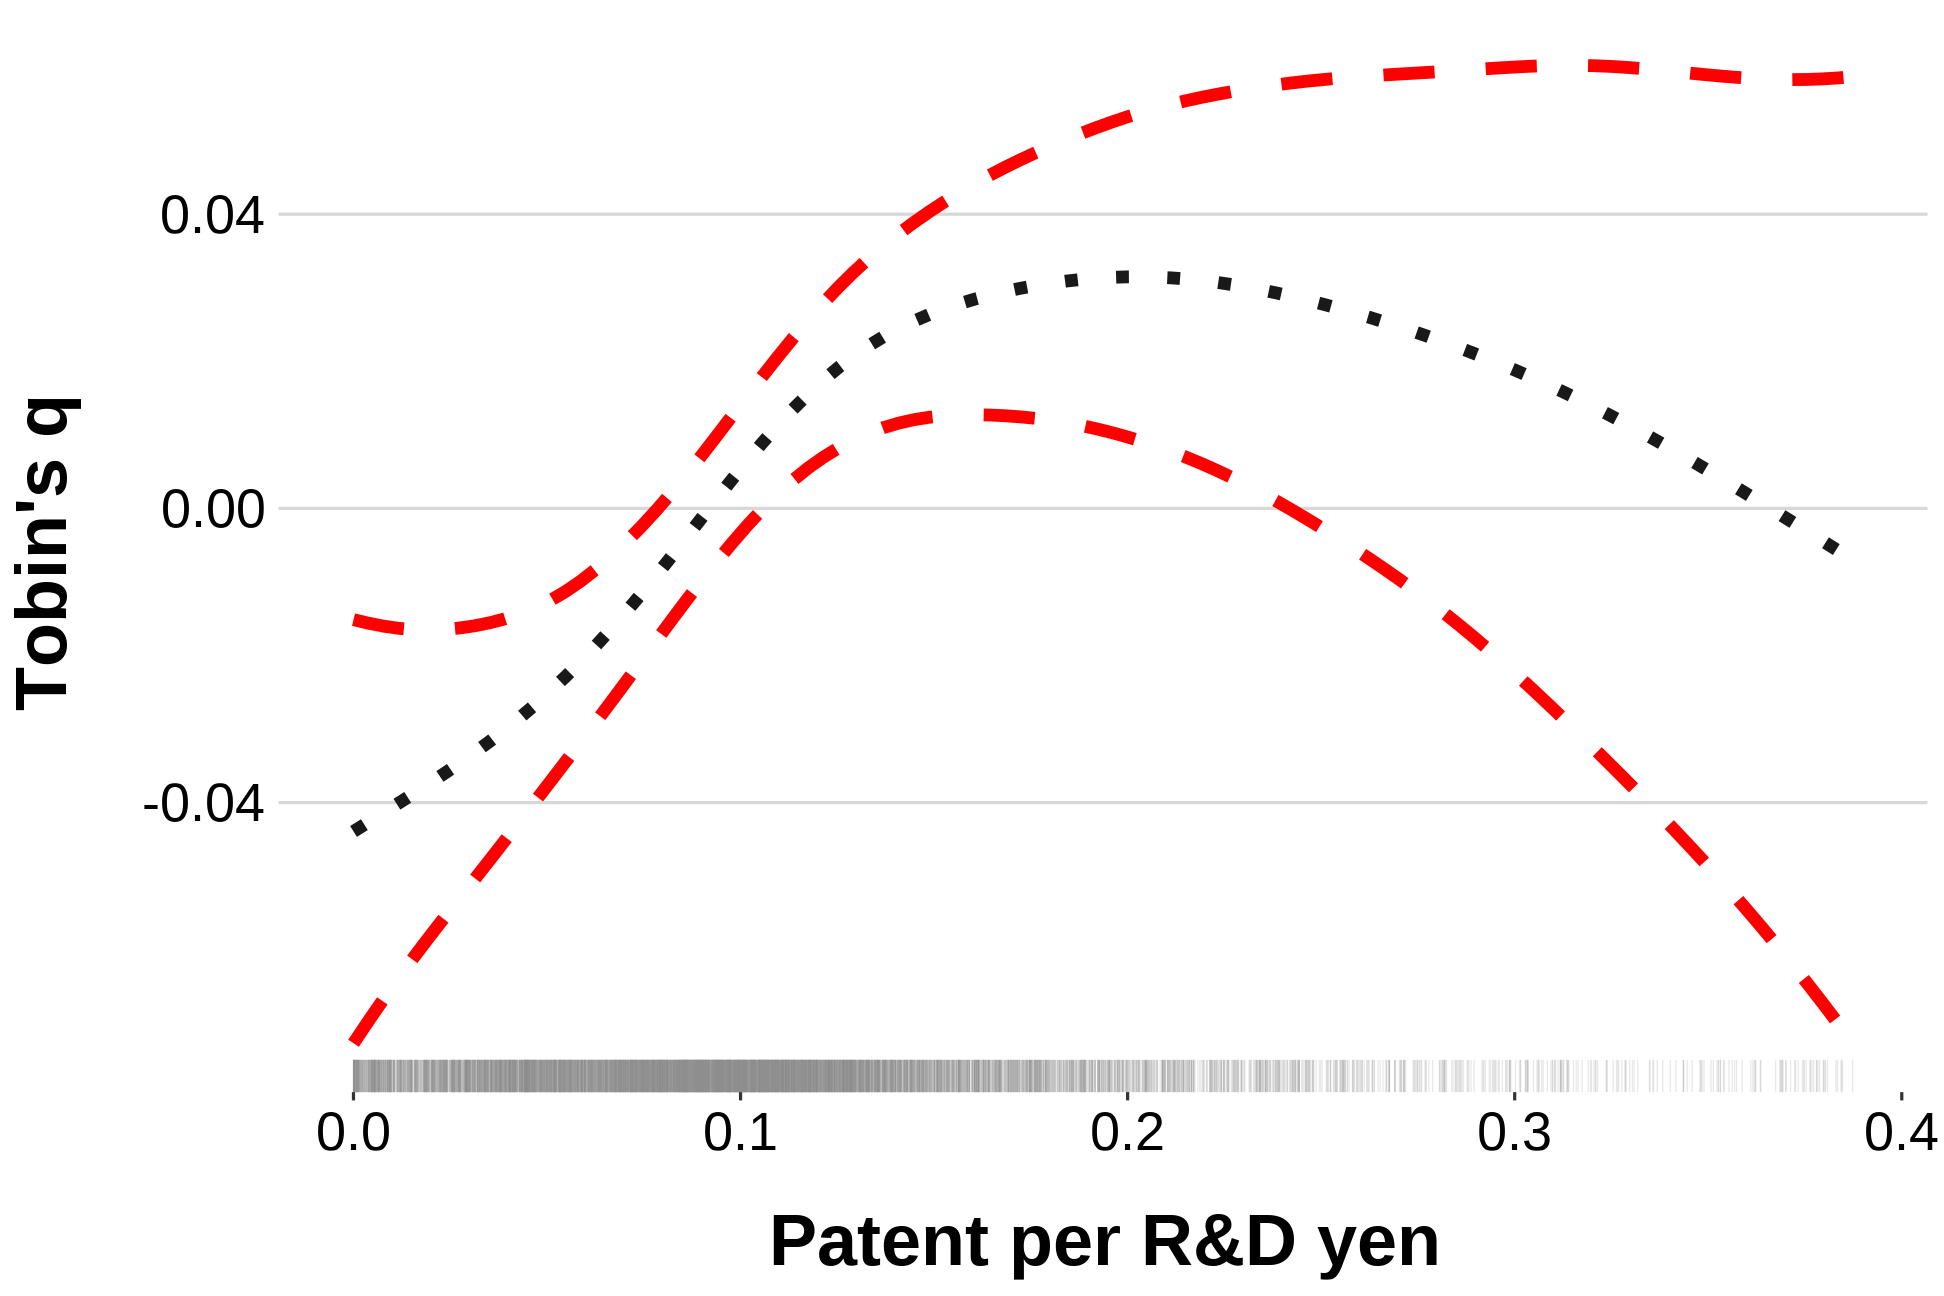
Patents per Japanese Yes spent on R&D
- Only Chemicals stand out for their R&D spending that translates into more inventions valued by market.
OLS regression
| OLS | OLS (Industrial) | |
|---|---|---|
| Constant | −0.316 (0.055)*** | −0.407 (0.068)*** |
| D (Electric) | 0.069 (0.015)*** | 0.068 (0.076) |
| D (Machinery) | 0.012 (0.029) | 0.255 (0.069)*** |
| D (Pharm) | 0.356 (0.025)*** | 0.268 (0.132)* |
| R&D/Assets (x Chemical) | 0.019 (0.066) | 0.608 (0.096)*** |
| R&D/Assets x Electric | −0.288 (0.093)** | |
| R&D/Assets x Machinery | 0.611 (0.178)*** | |
| R&D/Assets x Pharm | 0.537 (0.204)** | |
| Patents/R&D (x Chemical) | 0.024 (0.081) | 1.018 (0.156)*** |
| Patents/R&D x Electric | −0.916 (0.207)*** | |
| Patents/R&D x Machinery | −2.640 (0.251)*** | |
| Patents/R&D x Pharm | −0.729 (0.520) | |
| Citations/Patents (x Chemical) | 0.058 (0.013)*** | −0.014 (0.018) |
| Citations/Patents x Electric | 0.187 (0.026)*** | |
| Citations/Patents x Machinery | 0.103 (0.026)*** | |
| Citations/Patents x Pharm | −0.033 (0.037) | |
| R&D Intensity | 0.738 (0.118)*** | 0.044 (0.130) |
| Process Innovation | 0.033 (0.011)** | 0.032 (0.011)** |
| Leverage | 1.287 (0.038)*** | 1.086 (0.042)*** |
| ROA | 2.716 (0.106)*** | 2.656 (0.106)*** |
| Capital Intensity | 0.038 (0.005)*** | 0.045 (0.005)*** |
| Age | −0.001 (0.000)*** | −0.001 (0.000)*** |
| Num.Obs. | 6903 | 6903 |
| R2 | 0.292 | 0.310 |
| RMSE | 0.41 | 0.40 |
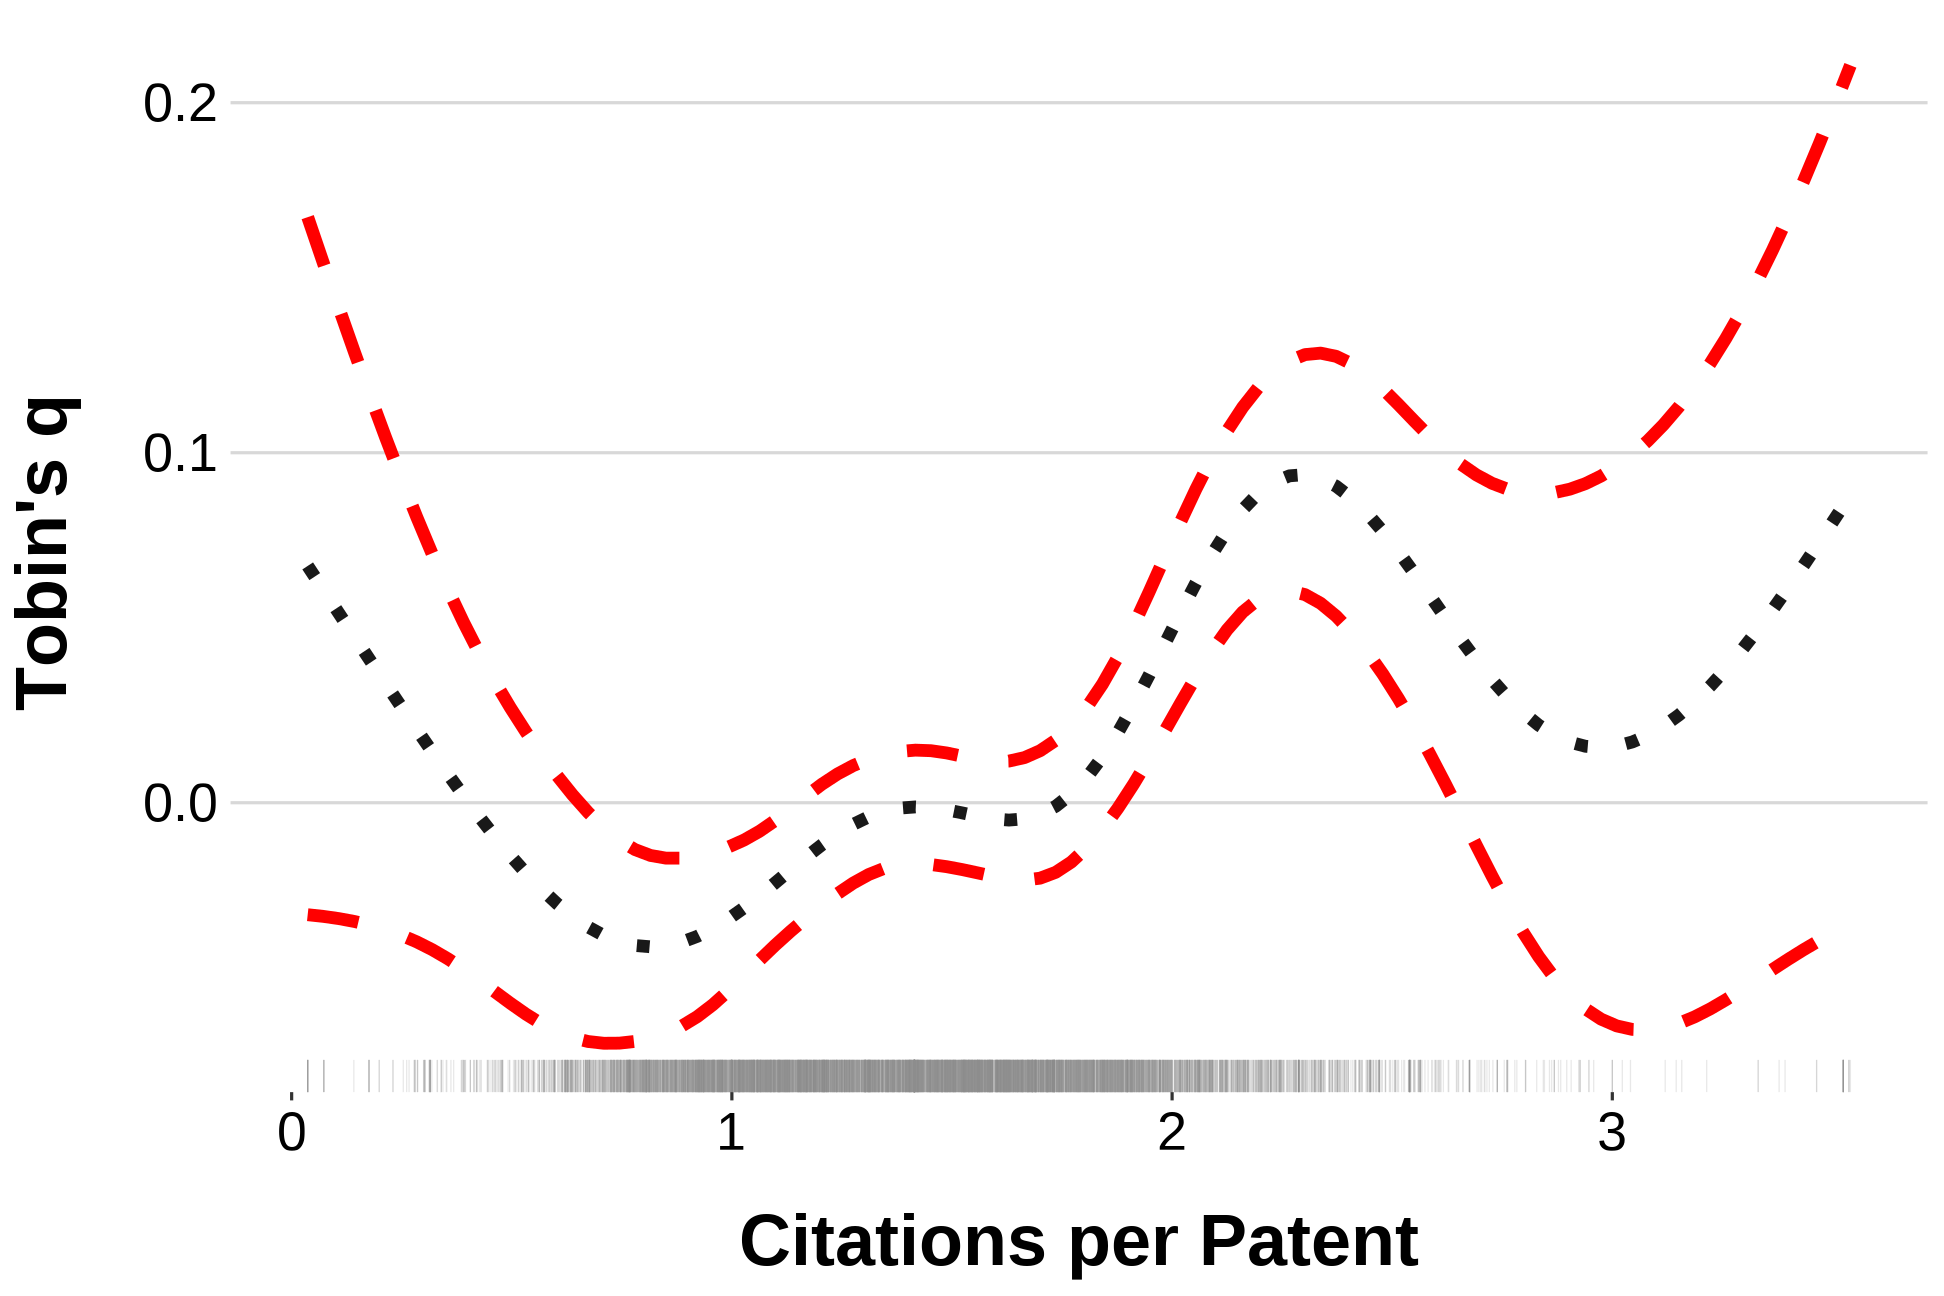
Citations per Patent
Electrical Equipment and Machinery: peculiar for receiving market premium for more influential patents.
Thus, quality of patents is particularly important for the manufacturing sector
For Chemicals, based on GAMs, there is an evidence of a positive market reaction when the Cit/Pat ratio rises from 3 to 6
Generalized Additive Models (GAMs)
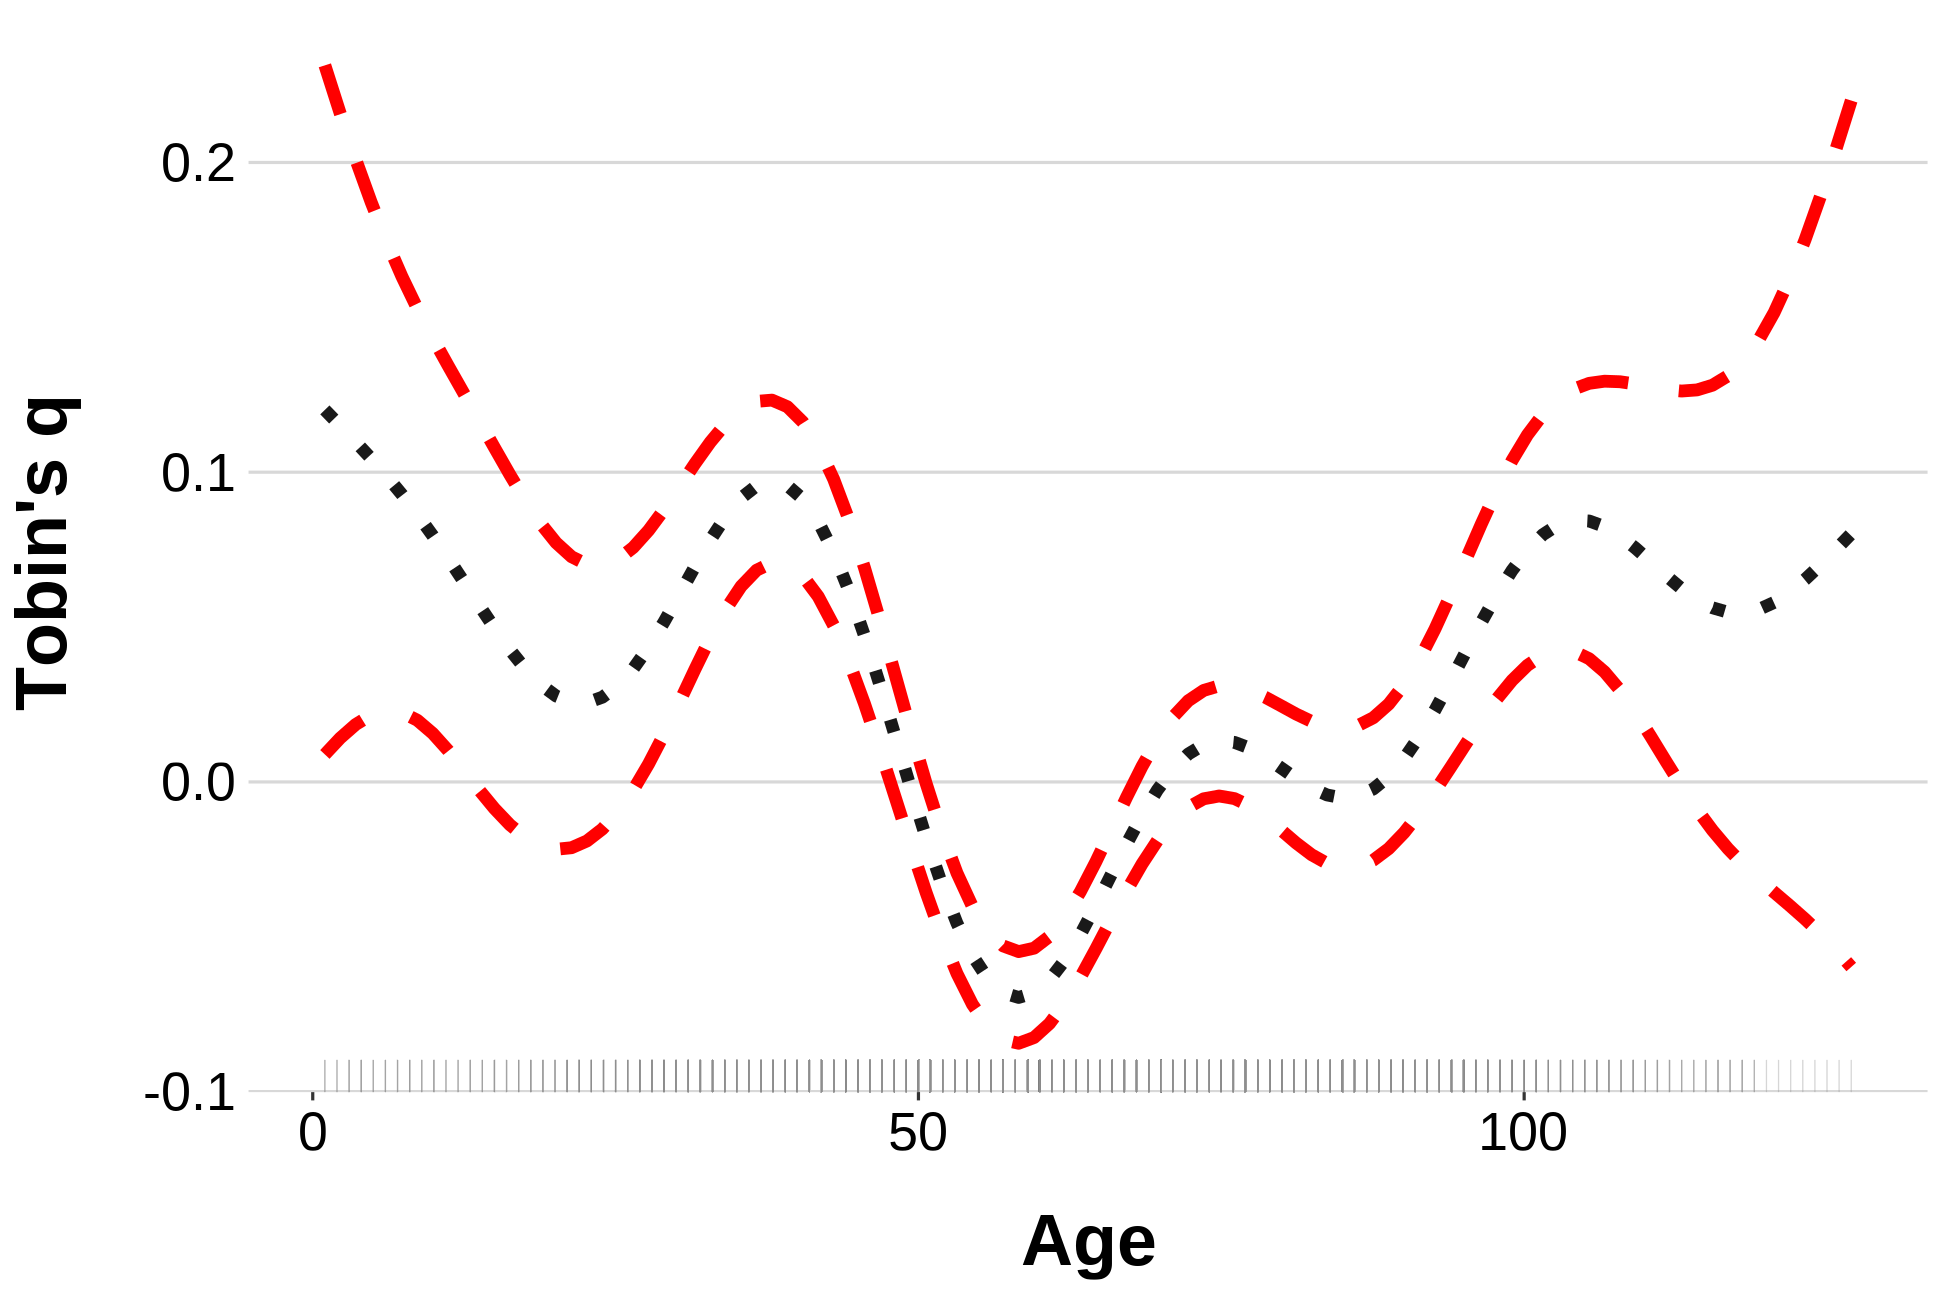
With the medium age of the companies analyzed being 59 years, it can be concluded from the Figure that TSE expects companies with the age below this median value to be less innovative as they get older.
The opposite also holds true: firms that passed the median-age threshold are seen to be more likely to generate knowledge as their age increases.
In other words, new market entrants as well as the undoubtedly experienced players tend to be more attractive to investors.
Conclusions
Conclusions
1. Institutional features associated with R&D spending provide valuable signals for investors across multiple industries.
- Most of the companies, but especially the ones belonging to Pharm and Chemical industries are still embedded in a system of industrial coordination. Oligopolistic features still prevalent
Conclusions
1. Institutional features associated with R&D spending provide valuable signals for investors across multiple industries.
2. Quality of a patented output (Citations per Patent) mostly matters for the manufacturing sector.
- Most of the companies, but especially the ones belonging to Pharm and Chemical industries are still embedded in a system of industrial coordination. Oligopolistic features still prevalent
- Thereby these companies react to the accumulating competitive pressures and are redefining themselves within an open-market system
Conclusions
1. Institutional features associated with R&D spending provide valuable signals for investors across multiple industries.
2. Quality of a patented output (Citations per Patent) mostly matters for the manufacturing sector.
3. Pronounced nonlinear trend in the market perception of corporate age: only the more experienced companies receive market premium as they get older.
Limitations
Only utilized the JPO data, need to look at Triadic Patents as well
Find out the updated depreciation rates for the knowledge stocks (per industry)
Possibly including corporate governance and shareholding structure to better capture the institutional aspects of innovation
- Most of the companies, but especially the ones belonging to Pharm and Chemical industries are still embedded in a system of industrial coordination. Oligopolistic features still prevalent
- Thereby these companies react to the accumulating competitive pressures and are redefining themselves within an open-market system
References
Goto, A. and K. Motohashi (2007). "Construction of a Japanese Patent Database and a First Look at Japanese Patenting Activities". En. In: Research Policy 36.9, pp. 1431-1442. ISSN: 00487333. DOI: 10.1016/j.respol.2007.06.005.
Griliches, Z. (1981). "Market Value, R&D, and Patents". En. In: Economics Letters 7.2, pp. 183-187. ISSN: 0165-1765. DOI: 10.1016/0165-1765(87)90114-5.
Hall, B. H., A. Jaffe, and M. Trajtenberg (2005). "Market Value and Patent Citations". In: RAND Journal of economics, pp. 16-38. ISSN: 0741-6261.
Kogut, B. and U. Zander (1992). "Knowledge of the Firm, Combinative Capabilities, and the Replication of Technology". In: Organization Science 3.3, pp. 383-397. ISSN: 1047-7039. DOI: 10.1287/orsc.3.3.383.
Thank You for Your attention!
Questions / Suggestions?
You can access the presentation & contact me
| [email protected] | |
| kovsiannikov.com |